November 2022
Capital Markets Commentary
» Equity Markets Post Strong Performance
» Fed Continues to Hike
» U.S. Economy Showing Mixed Signals
» Fed Continues to Hike
» U.S. Economy Showing Mixed Signals

Key Takeaways
MARKET UPDATE
The Dow Jones Industrial Average had its best performing month since 1976 in October, increasing +14.1%. When looking at the market on a broader scale, the S&P 500 Index posted a strong total return of +8.1%, even though earnings results for the third quarter have been mixed thus far. The tech heavy NASDAQ’s performance was pulled down to less than +4% for the month and is largely being attributed to poor earnings results from companies like Meta, Amazon, and Alphabet. The rapid increase in short-term interest rates is putting pressure on valuations, as investors shift their focus toward companies with lower P/E ratios relative to their peers. Style leadership continues to transition from Growth to Value oriented stocks. The sectors with the best performance for the month were energy and industrials, posting returns of nearly +25% and +14% respectively.
THE FEDERAL RESERVE
The Fed continues to tighten monetary policy and raised short-term interest rates for the sixth time this year. The FOMC increased the overnight lending rate by 0.75% in early November, making it the fourth time that they have increased rates by that amount and brings the total number of rate hikes in 2022 to six. This move took interest rates to their highest level since 2008. As expected, this action by the Fed has rapidly steepened the front end of the U.S. Treasury yield curve and the demand for longer dated Treasury maturities continue to wane.
U.S. INTEREST RATE HIKES
CURRENT CYCLE IS FASTEST SINCE 1983
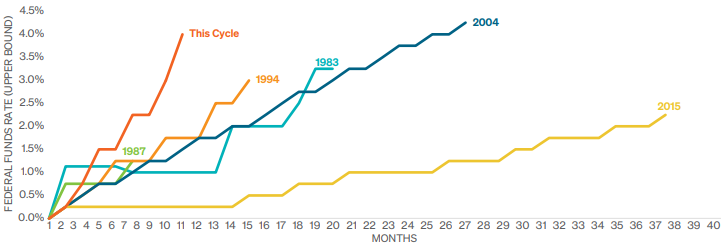
SOURCE: BLOOMBERG DATA THROUGH 11/3/2022
When looking back at other rising rate environments, the current cycle has experienced the fastest rise in interest rates since 1983. This is significant because the yield curve is often viewed by investors to be a leading indicator of future U.S. economic growth or contraction. In a period of expected growth, the yield curve is upward sloping; meaning that investors earn a higher yield from lending money over longer periods of time. An inversion occurs when there is more uncertainty about the longer-term economic outlook and investors buy shorter-term securities. In essence, the Fed is increasing short-term rates to encourage investors to save money, rather than spending it. It also causes banks and other lending institutions to increase the interest rate on loans. This makes it more expensive for borrowers and over time, will reduce demand and decrease the amount of money circulating in the economy. The Fed’s primary goal right now is to bring down the highest inflation we’ve experienced in decades.
Prior to each recession in the U.S., the yield curve inverted when the 2-year Treasury yield exceeded the 10-year. This 2/10 inversion occurred earlier in the year, but this month the curve inverted even further when the 3-month Treasury yield exceeded the 10-year yield. So far, this is the most rapid rise in the effective Federal Funds rate of a rate tightening cycle that has occurred in the past 35 years. Investors are growing weary about the Feds ability to provide a “soft landing” to the U.S. economy by slowing growth without pushing it into a recession. According to Strategas, analyst consensus estimates for a recession occurring in late 2023 have risen to a probability of 60%.
Prior to each recession in the U.S., the yield curve inverted when the 2-year Treasury yield exceeded the 10-year. This 2/10 inversion occurred earlier in the year, but this month the curve inverted even further when the 3-month Treasury yield exceeded the 10-year yield. So far, this is the most rapid rise in the effective Federal Funds rate of a rate tightening cycle that has occurred in the past 35 years. Investors are growing weary about the Feds ability to provide a “soft landing” to the U.S. economy by slowing growth without pushing it into a recession. According to Strategas, analyst consensus estimates for a recession occurring in late 2023 have risen to a probability of 60%.
THE ECONOMY
The U.S. economy continues to show mixed signals about its strength. Some of those more favorable signs included the initial report for third quarter GDP report of 2.6% that exceeded forecasts of 2.4%. Additionally, the Bureau of Labor Statistics reported that the number of job openings in October increased by 437,000 to a total of 10.72 million jobs. This increase was unexpected as it is trending in the opposite direction of what the Fed would expect to see during a monetary tightening environment.
One indicator used to measure the current economic environment is the University of Michigan Index of Consumer Sentiment. This survey asks 500 U.S. households different questions that focus on their personal financial situation, as well as their view of the economy over the near- and long-term. The October level of 59.9 increased from the September reading of 58.6. However, the year-to-date average remains at the lowest level since the survey’s inception back in 1961. On the surface, it appears that this is a bad thing. Some investors look at consumer sentiment from a contrarian point of view and interpret this as a bullish signal that the market could be at an inflection point.
It is no surprise that higher interest rates have caused a slowdown in the housing market. According to the Mortgage Bankers Association, mortgage demand reached a seven year low as the average rate for a 30-year mortgage reached 7.14%, making it the highest level since 2001. Non-farm payrolls added 261,000 jobs to the U.S. economy this month, beating expectations of 200,000. It is positive that the economy continues to add jobs, but this was the lowest increase since December2020. Unemployment ticked up slightly from 3.5% in September to 3.7%.
Service oriented companies continue to grow but are showing signs of a slowdown according to the latest ISM Non-Manufacturing PMI Survey. The index fell from 56.7 in September to a level of 54.4 in October. This marks the slowest expansion that the services industry has seen since May of 2020. ISM Manufacturing PMI slowed month over month from 50.9 in September to a level of 50.2. For both indices, ISM levels above 50 signal expansion, and a level below 50 signals a contraction.
INDEX OF CONSUMER SENTIMENT
AS OF NOVEMBER 1, 2022
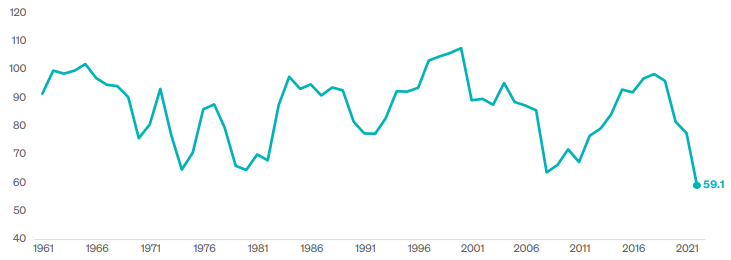
SOURCE: UNIVERSITY OF MICHIGAN
The views expressed herein are exclusively those of Meeder Investment Management, Inc., are not offered as investment advice, and should not be construed as a recommendation regarding the suitability of any investment product or strategy for an individual’s particular needs. Investment in securities entails risk, including loss of principal. Asset allocation and diversification do not assure a profit or protect against loss. There can be no assurance that any investment strategy will achieve its objectives, generate positive returns, or avoid losses.
Commentary offered for informational and educational purposes only. Opinions and forecasts regarding markets, securities, products, portfolios, or holdings are given as of the date provided and are subject to change at any time. No offer to sell, solicitation, or recommendation of any security or investment product is intended. Certain information and data has been supplied by unaffiliated third parties as indicated. Although Meeder believes the information is reliable, it cannot warrant the accuracy, timeliness or suitability of the information or materials offered by third parties.
Investment advisory services provided by Meeder Asset Management, Inc.
©2022 Meeder Investment Management, Inc.
0116-MAM-11/14/22-13399