You are now leaving Meeder Investment Management. Links to other websites are provided for your convenience and information only. When you click on a link to another website you will be leaving this website. The fact that Meeder Investment Management provides links to other websites does not mean that we endorse, authorize or sponsor the linked website, or that we are affiliated with that website’s owners or sponsors. This material is being provided for informational purposes only and is not a solicitation or an offer to buy any security or to participate in any planning or investment strategy. Unless otherwise indicated, the linked sites are not under our control and we are not responsible for and assume no liability for the content or presentation of any linked site or any link contained in a linked site, or any changes or updates to such sites. We make no representations about the accuracy or completeness of the information contained in any linked sites and their privacy and security policies may differ from ours. We recommend that you review this third-party’s policies and terms carefully.

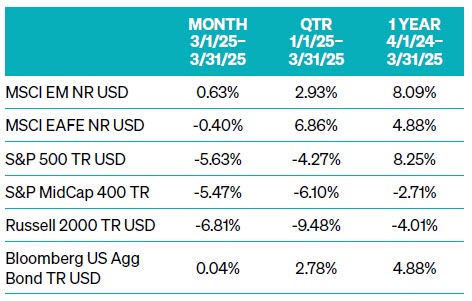
The S&P 500 rose 2.78% in January, while mid-cap stocks outperformed with a 3.85% gain. Developed international equities, represented by the MSCI EAFE Index, advanced 5.26%, and emerging markets added 1.79%. Even the bond market participated in the rally, with the Bloomberg U.S. Aggregate Bond Index returning 0.53%. This early strength was supported by steady job creation—the U.S. economy added 143,000 jobs in January—and easing inflation, particularly in energy prices. The Federal Reserve held rates steady at 4.25%–4.50%, as expected, reinforcing the “soft landing” narrative that had carried markets through late 2024.
The University of Michigan’s 1-year inflation expectations survey reflected a sharp rise in consumer concerns, with expectations jumping from 3.3% in January to 4.3% in February. Why is this important? It matters because perception drives behavior. If consumers expect prices to rise, they spend differently, affecting the broader economy.
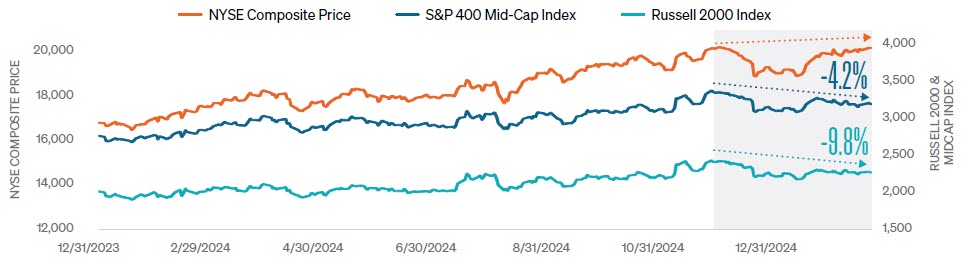
By mid-February, signs of fragility began to emerge beneath the surface. While large-cap indices continued to climb, participation narrowed. Small- and mid-cap stocks, which had closely tracked large-cap gains through the end of last year, began to lag as illustrated in FIGURE 1. Breadth indicators—such as advance-decline lines and the number of stocks reaching new 52-week highs turned decisively negative.
Inflation surveys conducted before the tariff announcement already hinted at building pressure. The Richmond Fed’s business inflation expectations rose above 7% over the next six months, reaching the highest level in decades. Similarly, the University of Michigan’s one-year consumer inflation outlook climbed to nearly 5%, well above the Federal Reserve’s 2% target. These indicators are expected to rise further in the wake of the tariff announcement, complicating the Fed’s policy path.
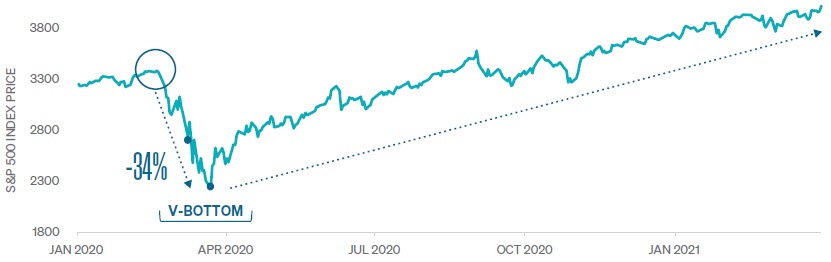
Meanwhile, investor sentiment has turned decisively negative. The CBOE Volatility Index (VIX) surged to 52—its highest reading since March 2020, reflecting extreme levels of fear in the market. The AAII sentiment survey showed bearish investor sentiment reaching 62%, levels previously seen only during the 2008 crisis and the COVID-19 shock. Historically, such extreme readings have often occurred near market bottoms, but there is no guarantee of a quick recovery. In fact, in 2008, similar pessimism persisted for months before markets began to stabilize.
At Meeder, our investment process uses a weight-of-the-evidence approach to remove emotion from the decision-making process to navigate through uncertainty. We continuously evaluate trends in market risk, economic data, and investor behavior to guide our strategies. With inflation still above the Fed’s comfort zone and monetary policy in a holding pattern, we believe a balanced and flexible approach remains key. Our models help us assess risks and rewards—and adjust positioning accordingly when the data calls for it.
As we move into the second quarter, we will remain diligently focused on trade policy developments, inflation trends, and market breadth. Though the path forward may be uneven, a disciplined approach combined with broad diversification remains one of the most effective ways to navigate uncertain markets.
In response to shifting global market conditions, the strategy increased its exposure to developed international equities. Improving economic data from Europe and Japan, combined with attractive valuations and a weakening U.S. dollar, created a favorable backdrop for non-U.S. markets. Developed international equities outperformed U.S. large caps during the quarter, and the allocation shift added meaningful diversification to the portfolio’s overall equity exposure.
Because the portfolio remains fully invested, this strategy did experience more volatility than other strategies. However, despite the evolving macro and political landscape, the Meeder Growth strategy capitalized on growth opportunities across global markets. History suggests that while uncertainty remains in the near term, such dislocations often set the stage for long-term opportunities.
During the first quarter of 2025, the Defensive Equity Strategy maintained a fully invested posture through much of January and February, driven by a favorable mix of low market volatility and contrarian investor sentiment. The VIX and MOVE indices are measures of expected volatility in equity and bond markets. During this time, both remained well below their long-term averages, signifying a stable market environment. Meanwhile, investor sentiment became increasingly bearish, with retail investor surveys, options
positioning, and newsletter sentiment all registering extreme pessimism. From a contrarian perspective, we viewed this as a bullish indicator, and it contributed to very positive short- and intermediate-term model scores. As a result, the strategy remained 100% invested from early January through February 7. However, concerns began to mount in late February and early March around stretched equity valuations, weakening market breadth, and rising inflation expectations. These factors contributed to a reduction in equity exposure to 95% on February 28, then to 92% on March 14.
March marked a steady transition from cautious optimism to heightened defensiveness. As the month progressed, equity market volatility ticked higher, particularly in response to growing concerns over trade tensions and signs of economic deceleration. The RISK component of the model, which had been supportive for most of the quarter, turned neutral by mid-March as volatility approached long-term averages. More importantly, deterioration in market internals became increasingly evident: only 15% of sub-industries showed positive momentum, a sharp decline from earlier in the quarter. This weakening breadth identified fewer stocks contributing to index-level gains and raised questions about the sustainability of the rally. On March 21, equity allocation was reduced again to 89% as model readings became more mixed. Despite the extreme bearish sentiment that kept the intermediate-term model at its most positive level, the long-term model score remained negative due to elevated valuations, persistent inflation pressures, and a weakening earnings outlook. Heading into April, the strategy adopted a more defensive stance, reflecting the rising fragility in equity markets even before the shock of the April 2 tariff announcement.
The turning point came in early April when the U.S. administration announced a sweeping set of new tariffs that significantly altered the market landscape. The announcement imposed a baseline 10% tariff across a broad set of imports, with higher effective rates targeting strategic partners, and caught investors by surprise with a larger-than-expected tariff rate and broader scope of the countries that were included in the tariffs. Investors reacted swiftly and severely. From April 2 to April 4, the S&P 500 fell more than 10%, marking one of the steepest short-term equity market declines since 1952. In response, the strategy further reduced equity exposure to 73% as both short-term and long-term model signals deteriorated. Market breadth collapsed, with only 8% of sub-industries exhibiting positive momentum over the prior month. At the same time, both the VIX and MOVE indices surged above their long-term averages, turning the RISK component of the model negative. While bearish sentiment across surveys, options markets, and newsletters reached historic extremes, longer-term concerns around elevated valuations, rising inflation, and weakening earnings momentum kept the strategy defensively positioned. As of mid-April, the Defensive Equity Strategy remains at a 73% equity allocation, reflecting a balanced posture: cautious about structural market headwinds but attentive to the potential opportunities that can emerge from extreme investor pessimism.
Throughout the first quarter of 2025, the Meeder Fixed Income Strategy has remained active and responsive to changing market conditions, particularly as the Federal Reserve initiated its rate-cutting cycle, inflation data evolved, and global macro dynamics shifted. We entered the year with a short duration of 4.2 years, a defensive stance intended to manage interest rate risk as inflation remained stubborn and yields were trending higher. At that time, we also held an overweight position in high yield credit, reflecting confidence in economic growth and the supportive backdrop of early Fed easing. Emerging market debt remained underweight due to continued strength in the U.S. dollar. In late January, as inflation data cooled and interest rates declined, we extended duration to 6.5 years by month-end and slightly above our benchmark.
Through February, as the U.S. dollar weakened and positive momentum in global markets grew, we shifted to an overweight position in emerging market debt. By mid-February, we began to adopt a slightly more cautious stance in light spreads widening, reflecting a more defensive posture, and shifted our allocation to a higher credit quality of high-yield bonds.
In March, spreads in the high yield market began to widen, prompting a more cautious stance despite maintaining the overweight. We increased the duration further to 6.7 years, reflecting expectations for additional rate cuts and a supportive rate environment. We remained overweight in emerging market debt through most of the month, balancing attractive yields with increasing geopolitical and currency risk.
In response to renewed strength in the U.S. dollar and rising global uncertainties, we exited our position in emerging market debt in early April, reallocating to U.S. Treasuries and shifting back to an underweight posture in EM debt. At the same time, we extended the duration to 7.1 years, taking advantage of declining rates. However, this was shortly followed by an additional duration reduction to 6.7 years to recalibrate interest rate exposure and better align with the risk/reward profile as market conditions evolved.
Duration has shifted materially over the quarter—from 4.2 years at the start of January to 6.7 years currently— highlighting our active stance in managing interest rate sensitivity in response to changing inflation and Fed policy dynamics. As we move into the second quarter, we remain focused on balancing income generation with risk management. We continue to monitor inflation, monetary policy, and credit conditions closely to align with our portfolio positioning.
INDEX DEFINITIONS:
S&P 500 Index: The Index tracks the stock performance of 500 of the largest companies listed on stock exchanges in the United States. It is one of the most followed equity indices and includes approximately 80% of the total market capitalization of U.S. public companies.
S&P 400 Index: The S&P MidCap 400® provides investors with a benchmark for mid-sized companies. The index, which is distinct from the large-cap S&P 500®, is designed to measure the performance of 400 mid-sized companies, reflecting the distinctive risk and return characteristics of this market segment.
Russell 2000 Index: The Index is constructed to provide a comprehensive, unbiased barometer of the small-cap segment of the U.S. equity market. A subset of the Russell 3000 Index, it includes approximately 2,000 of the smallest securities based on a combination of their market cap and current index membership.
MSCI EM Index: The Index captures large and mid-cap representation across 24 Emerging Markets (E.M.) countries. With 1,440 constituents, it covers approximately 85% of each country’s free float-adjusted market capitalization.
MSCI EAFE Index: The Index is an equity index that captures large and mid-cap representation across 21 Developed Markets countries* worldwide, excluding the U.S. and Canada. With 783 constituents, the index covers approximately 85% of each country’s free float-adjustedmarket capitalization. MSCI EM Index: The Index captures large and mid-cap representation across 24 Emerging Markets (E.M.) countries. With 1,440 constituents, it covers approximately 85% of each country’s free float-adjusted market capitalization.
Bloomberg U.S. Aggregate Bond Index: The Index is a broad-based flagship benchmark that measures the investment-grade, U.S. dollar-denominated, fixed-rate taxable bond market. The index includes Treasuries, government-related and corporate securities, fixed-rate agency MBS, ABS, and CMBS (agency and non-agency). Provided the necessary inclusion rules are met, U.S. Aggregate-eligible securities also contribute to the multi-currency Global Aggregate Index and the U.S. Universal Index. The U.S. Aggregate Index was created in 1986, with history backfilled to January 1, 1976.
Commentary offered for informational and educational purposes only. Opinions and forecasts regarding markets, securities, products, portfolios, or holdings are given as of the date provided and are subject to change at any time. No offer to sell, solicit, or recommend any security or investment product is intended. Certain information and data has been supplied by unaffiliated third parties as indicated. Although Meeder believes the information is reliable, it cannot warrant the accuracy, timeliness or suitability of the information or materials offered by third parties.
The views expressed herein are exclusively those of Meeder Investment Management, Inc., are not offered as investment advice, and should not be construed as a recommendation regarding the suitability of any investment product or strategy for an individual’s particular needs. Investment in securities entails risk, including loss of principal. Asset allocation and diversification do not assure a profit or protect against loss. There can be no assurance that any investment strategy will achieve its objectives, generate positive returns, or avoid losses.
Investors cannot invest directly in an index. The performance of any index is not indicative of the performance of any investment and does not take into account the effects of inflation and the fees and expenses associated with investing.
Investment advisory services offered by Meeder Advisory Services, Inc.
0289-MAS-4/22/25-50168