You are now leaving Meeder Investment Management. Links to other websites are provided for your convenience and information only. When you click on a link to another website you will be leaving this website. The fact that Meeder Investment Management provides links to other websites does not mean that we endorse, authorize or sponsor the linked website, or that we are affiliated with that website’s owners or sponsors. This material is being provided for informational purposes only and is not a solicitation or an offer to buy any security or to participate in any planning or investment strategy. Unless otherwise indicated, the linked sites are not under our control and we are not responsible for and assume no liability for the content or presentation of any linked site or any link contained in a linked site, or any changes or updates to such sites. We make no representations about the accuracy or completeness of the information contained in any linked sites and their privacy and security policies may differ from ours. We recommend that you review this third-party’s policies and terms carefully.
» International
» The Federal Reserve
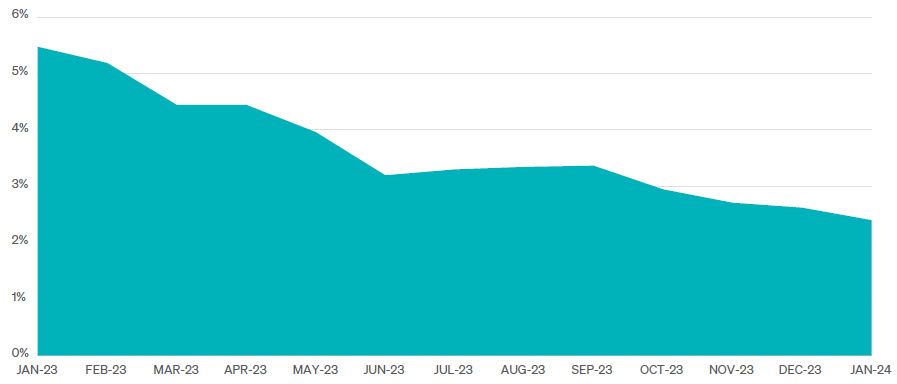
» Inflation
» Labor Market
» Business Activity

It looks like investors are finally coming around to the Fed’s outlook on the future of rate cuts. At the beginning of the year, the CME’s FedWatch tool showed that investors expected the FOMC to have six to seven interest rate cuts in 2024. However, after strong economic growth and continued caution from the Fed, they are currently only pricing in three rate cuts this year.
Equity markets showed resilience amid broader economic uncertainties, while bond markets faced challenges. With central bank policies and economic indicators influencing market sentiment, investors must remain vigilant, emphasizing the need for a balanced and diversified investment approach to navigate these evolving market conditions.
Commentary offered for informational and educational purposes only. Opinions and forecasts regarding markets, securities, products, portfolios, or holdings are given as of the date provided and are subject to change at any time. No offer to sell, solicitation, or recommendation of any security or investment product is intended. Certain information and data has been supplied by unaffiliated third parties as indicated. Although Meeder believes the information is reliable, it cannot warrant the accuracy, timeliness or suitability of the information or materials offered by third parties.
Investment advisory services provided by Meeder Asset Management, Inc.
INDEX DESCRIPTIONS
S&P 500 Index: The Index tracks the stock performance of 500 of the largest companies listed on stock exchanges in the United States. It is one of the most followed equity indices and includes approximately 80% of the total market capitalization of U.S. public companies.
S&P 400 MidCap Index: The Index serves as a gauge for the U.S. mid-capequities sector and is the most widely followed mid-cap index. To be included in the index, a stock must have a total market capitalization that ranges from $5.8 billion to $15.8 billion.
Russell 2000 Index: The Index is constructed to provide a comprehensive, unbiased barometer of the small-cap segment of the US equity market. A subset of the Russell 3000 Index, it includes approximately 2,000 of the smallest securities based on a combination of their market cap and current index membership.
MSCI EAFE Index: The Index is an equity index that captures large and mid-cap representation across 21 Developed Markets countries* around the world, excluding the US and Canada. With 783 constituents, the index covers approximately 85% of the free float-adjusted market capitalization in each country.
MSCI EM Index: The Index captures large and mid-cap representation across 24 Emerging Markets (EM) countries*. With 1,440 constituents, the index covers approximately 85% of the free float-adjusted market capitalization in each country.
Bloomberg US Aggregate Bond Index: The Index is a broad-based flagship benchmark that measures the investment-grade, US dollardenominated, fixed-rate taxable bond market. The index includes Treasuries, government-related and corporate securities, fixed-rate agency MBS, ABS, and CMBS (agency and non-agency). Provided the necessary inclusion rules are met, US Aggregate-eligible securities also contribute to the multi-currency Global Aggregate Index and the US Universal Index. The US Aggregate Index was created in 1986, with history backfilled to January 1, 1976.
©2024 Meeder Investment Management, Inc.
0116-MAM-3/14/24-41274