You are now leaving Meeder Investment Management. Links to other websites are provided for your convenience and information only. When you click on a link to another website you will be leaving this website. The fact that Meeder Investment Management provides links to other websites does not mean that we endorse, authorize or sponsor the linked website, or that we are affiliated with that website’s owners or sponsors. This material is being provided for informational purposes only and is not a solicitation or an offer to buy any security or to participate in any planning or investment strategy. Unless otherwise indicated, the linked sites are not under our control and we are not responsible for and assume no liability for the content or presentation of any linked site or any link contained in a linked site, or any changes or updates to such sites. We make no representations about the accuracy or completeness of the information contained in any linked sites and their privacy and security policies may differ from ours. We recommend that you review this third-party’s policies and terms carefully.

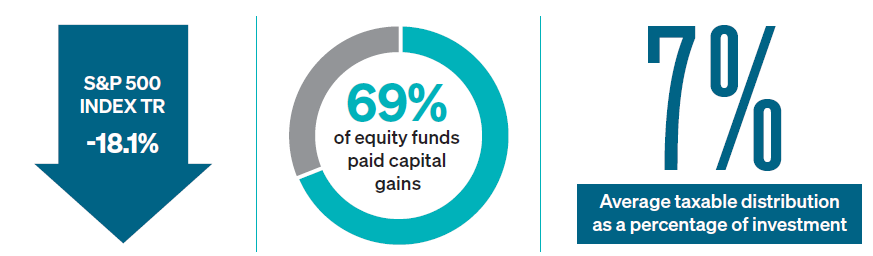
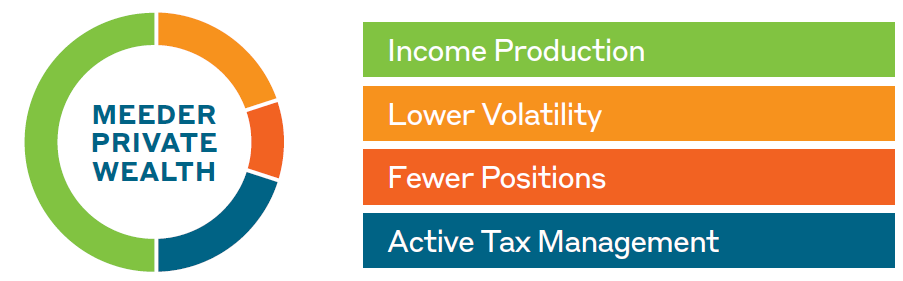
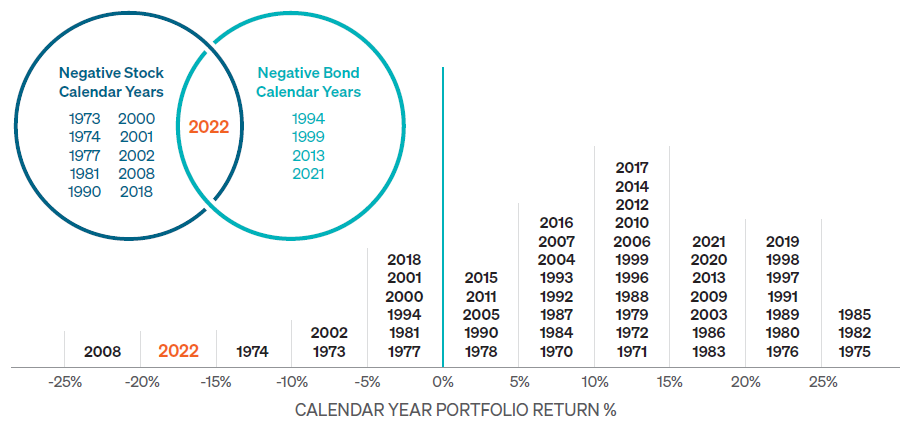
While many mutual funds were down last year alongside the market, nearly 70% of those funds still paid capital gains—and significant capital gains—to the tune of an average 7% of the investment. These capital gains had the effect of increasing a client’s tax liability. Compare that with the private wealth custom SMA structure where the client owns all their individual positions cost basis—versus a mutual fund, where they share that cost basis with everyone else. This structure allowed us to actively manage tax at the individual account level throughout the year and resulted in many of our clients having a significantly reduced tax liability, or said another way, allowed us to generate tax alpha for our clients.
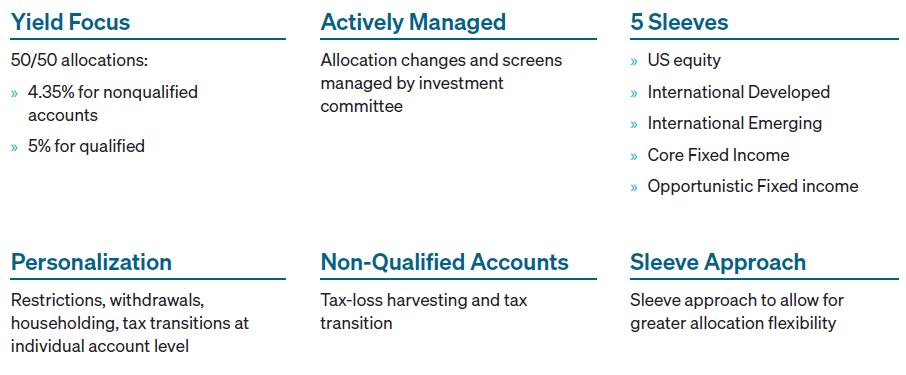
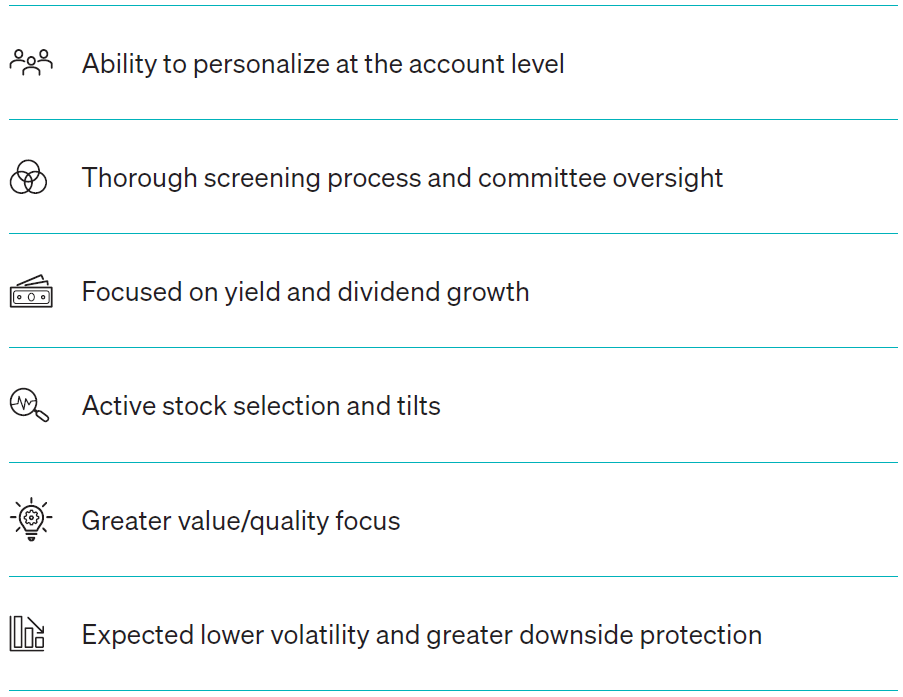
While active tax management is at the core of private wealth, we also realize that for some clients or some clients’ accounts, this is not always their primary objective. Many clients seek a strategy whereby the primary objective is income-producing holdings. Our dividend income strategy, inside of private wealth accounts, is a globally diversified portfolio constructed with income-generating positions, while still looking to grow capital.
Investing in a portfolio of stocks with dividend yield can be appealing for many reasons. Most obvious is their ability to generate extra income. This isn’t relevant only for those clients seeking to take income. Many will reinvest the income back into the portfolio, which can significantly increase the total return of that investment over time. Additionally, dividend-focused strategies can help to cushion that decline in periods of market downturns.
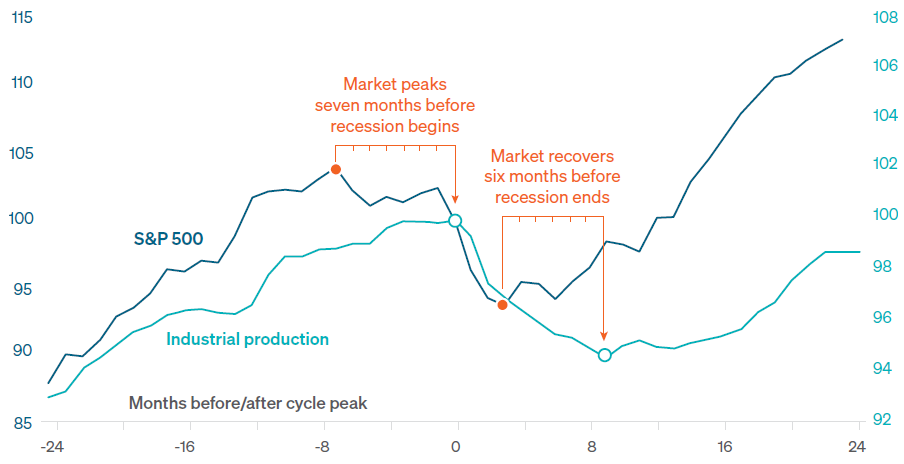
The stock market is a leading indicator and tends to bottom and recover before the economic data does. The key takeaway being that timing the market is challenging. Many clients would prefer to wait until the economic data improves before investing. If you wait for the data to improve to get invested, you will have missed the opportunity.
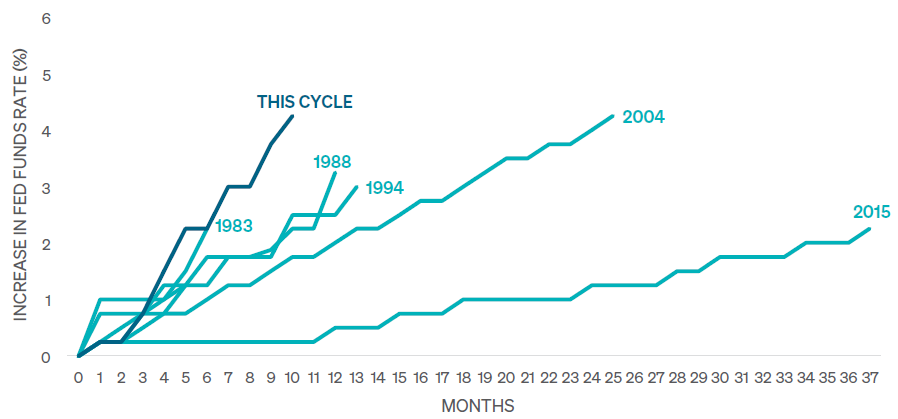
One of the key reasons the Fed is hiking rates is inflation.
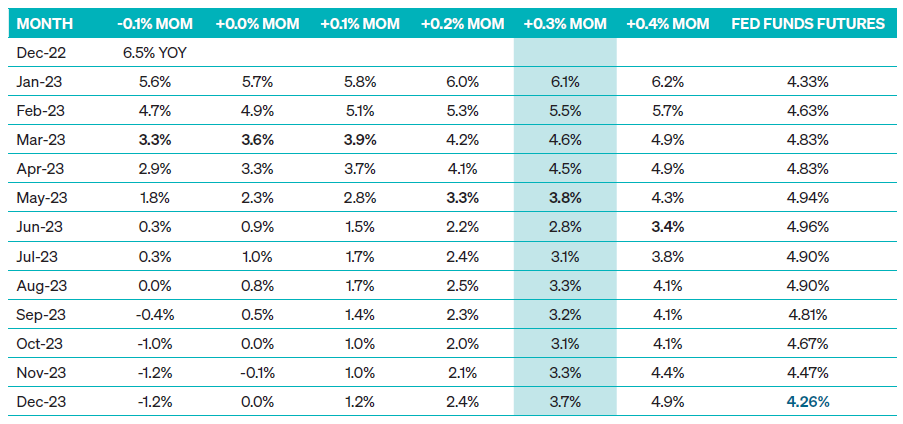
It is also important to note that the market is pricing in two to three rate cuts in late 2023. For the Fed to cut rates, it would require further deterioration in economic conditions and inflation to continue to fall.
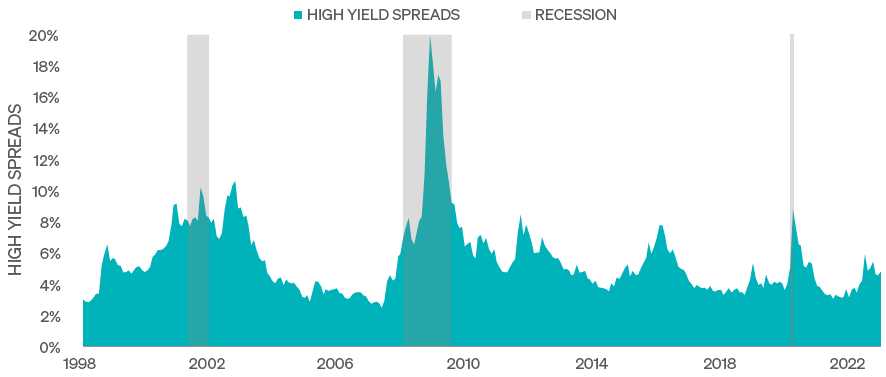
Our team monitors high yield bond spreads to determine how markets view the credit conditions of corporate borrowers. During recessionary conditions, spreads typically widen significantly and are nearly double where they are currently. We would expect high yield spreads to widen on credit stress from weaker economic conditions or increased potential defaults. We are underweight high yield investments and would prefer to see spreads widen prior to adding exposure.
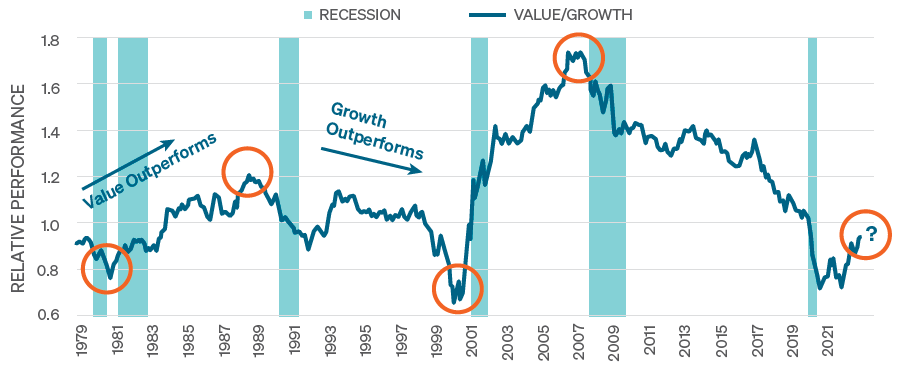
As we highlighted previously, growth has outperformed value for over 15 years. From mid-2007 to 2020, the ratio of performance between value and growth investments declined steadily. These cycles are long and can stretch for decades. At the present time, US value stocks are attractive from a valuation perspective relative to US growth investments.
Our team has taken the recent market volatility as an opportunity to reassess portfolio allocations and confirm they are in line with our clients’ goals and objectives. Please reach out to our team where we can assist your practice or clients.
The views expressed herein are exclusively those of Meeder Investment Management, Inc., are not offered as investment advice, and should not be construed as a recommendation regarding the suitability of any investment product or strategy for an individual’s particular needs. Investment in securities entails risk, including loss of principal. Asset allocation and diversification do not assure a profit or protect against loss. There can be no assurance that any investment strategy will achieve its objectives, generate positive returns, or avoid losses.
Commentary offered for informational and educational purposes only. Opinions and forecasts regarding markets, securities, products, portfolios, or holdings are given as of the date provided and are subject to change at any time. No offer to sell, solicitation, or recommendation of any security or investment product is intended. Certain information and data has been supplied by unaffiliated third parties as indicated. Although Meeder believes the information is reliable, it cannot warrant the accuracy, timeliness or suitability of the information or materials offered by third parties.
Investment advisory services provided by Meeder Asset Management, Inc.
©2023 Meeder Investment Management, Inc.
0183-MAS-01/31/2023-31577