TOTAL RETURNS
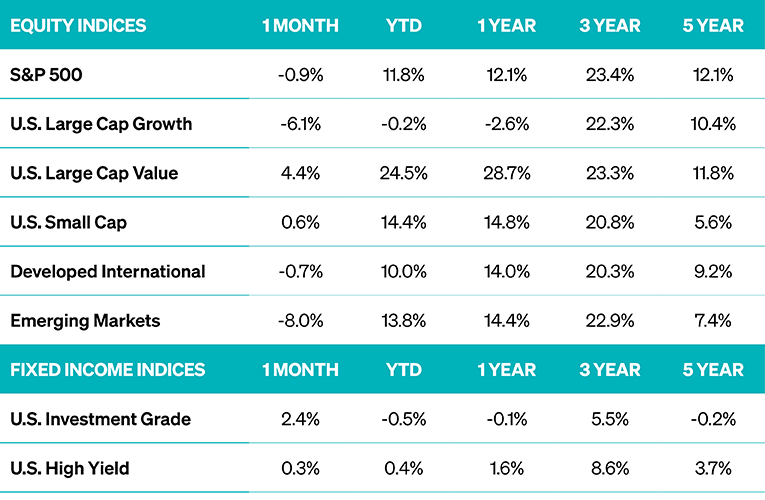
SOURCE: YCHARTS, MEEDER INVESTMENT RESEARCH AS OF 10/31/2026. THE PERFORMANCE DATA SHOWN REPRESENTS PAST PERFORMANCE, WHICH DOES NOT GUARANTEE FUTURE RESULTS.
INDICES: S&P 500 INDEX, RUSSELL 1000 GROWTH, RUSSELL 1000 VALUE, RUSSELL 2000, MSCI EAFE, MSCI EM, BLOOMBERG US AGG BOND, BLOOMBERG US CORPORATE HIGH YIELD
» Investors sold the AI trade in October without selling the market, while nine of eleven S&P 500 sectors rose. Doubts about big tech’s record spending built all month and peaked when Alphabet and Amazon reported slower growth in the businesses paying for it. Value beat growth by the widest monthly margin since 2001, and small caps recovered from a mid-month correction as rates eased.
» Emerging markets fell hardest, with the same selloff hitting Korean and Taiwanese chipmakers even as their profits kept climbing, and a surprise runoff result sinking Brazil. Developed international held near flat, since gains in Europe and the energy-heavy U.K. offset a chip-led slide in Japan.
» Investment-grade bonds had their best month in more than two years as the tech selloff sent investors into Treasuries, pulling the 10-year yield back below 5% despite rising oil and a Fed still leaning toward another hike. High yield lagged as spreads widened, led by debt-funded AI borrowers.
» The rotation had fundamentals behind it, as the rest of the S&P 500 is on track to grow earnings faster than the Magnificent Seven for the first time since 2022. With technology still more than a third of the index, owning the S&P 500 alone is a bigger bet on one theme than many clients realize.
THE AI TRADE HAS BEEN HERE BEFORE
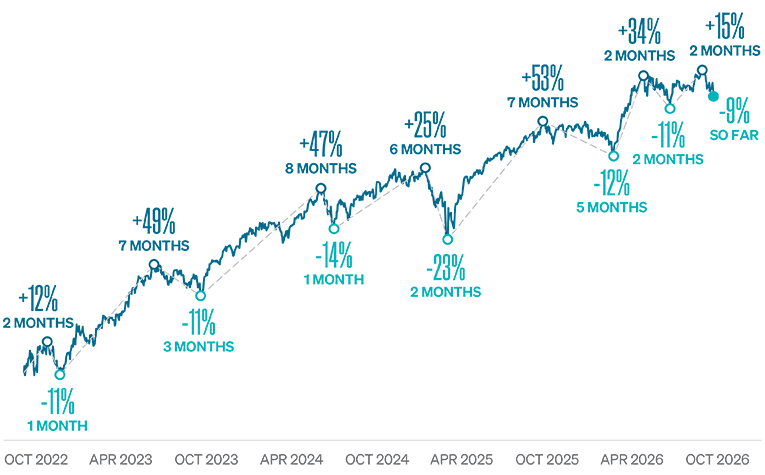
Six 10%-plus pullbacks since 2022, each recovered within three months of its low
Nasdaq-100 total return since the October 2022 low
SOURCE: YCHARTS, MEEDER INVESTMENT RESEARCH AS OF 10/31/2026. NASDAQ-100 TOTAL RETURN INDEX, DAILY CLOSES, OCT. 12, 2022 TO OCT. 30, 2026. PULLBACKS ARE DECLINES OF 10% OR MORE FROM A PRIOR PEAK. REBOUNDS RUN FROM EACH LOW TO THE NEXT PEAK. RECOVERY IS THE FIRST CLOSE ABOVE THE PRIOR PEAK. PAST PERFORMANCE DOES NOT GUARANTEE FUTURE RESULTS.
» The Nasdaq-100 has returned 171% since its October 2022 low despite six drops of 10% or more, roughly one every eight months, and each was fully recovered within three months of its low. The deepest, a 23% slide into the April 2025 tariff shock, gave way to the strongest rebound.
» October’s selloff left the index 9% below its October 6 record, just shy of a seventh drop after briefly crossing the 10% line. The last two rallies also ran just two months each, against six to eight earlier in the run, as a 10-year yield near 5% and sharper scrutiny of AI spending leave investors quicker to sell.
» None of this guarantees the next recovery, but it shows how costly selling into these drops has been. Spreading equity exposure across company sizes, styles, and regions makes the next drop far easier to wait out.
INDEX DESCRIPTIONS
Investors cannot invest directly in an index. The performance of any index is not indicative of the performance of any investment and does not take into account the effects of inflation and the fees and expenses associated with investing.
S&P 500 Index: The Index tracks the stock performance of 500 of the largest companies listed on stock exchanges in the United States. It is one of the most followed equity indices and includes approximately 80% of the total market capitalization of U.S. public companies. Russell 1000 Growth Index: The Index measures the performance of the large-cap growth segment of the US equity universe. It includes those Russell 1000 companies with relatively higher price-to-book ratios, higher I/B/E/S forecast medium-term (2-year) growth, and higher sales per share historical growth. The Index is constructed to provide a comprehensive and unbiased barometer for the large-cap growth segment. The index is completely reconstituted annually to ensure new and growing equities are included and that the represented companies continue to reflect growth characteristics. Russell 1000 Value Index: The Index measures the performance of the large-cap value segment of the US equity universe. It includes those Russell 1000 companies with relatively lower price-to-book ratios, lower I/B/E/S forecast medium-term (2 years) growth, and lower sales per share historical growth (5 years). The Index is constructed to provide a comprehensive and unbiased barometer for the large-cap value segment. The index is completely reconstituted annually to ensure new and growing equities are included and that the represented companies continue to reflect value characteristics. Russell 2000 Index: The Index is constructed to provide a comprehensive, unbiased barometer of the small-cap segment of the US equity market. A subset of the Russell 3000 Index, it includes approximately 2,000 of the smallest securities based on a combination of their market cap and current index membership. MSCI EAFE Index: The Index is an equity index that captures large and mid-cap representation across 21 Developed Markets countries* around the world, excluding the US and Canada. With 783 constituents, the index covers approximately 85% of the free float-adjusted market capitalization in each country. MSCI EM Index: The Index captures large and mid-cap representation across 24 Emerging Markets (EM) countries*. With 1,440 constituents, the index covers approximately 85% of the free float-adjusted market capitalization in each country. Bloomberg US Aggregate Bond Index: The Index is a broad-based flagship benchmark that measures the investment grade, US dollar-denominated, fixed-rate taxable bond market. The index includes Treasuries, government-related and corporate securities, fixed-rate agency MBS, ABS, and CMBS (agency and non-agency). Provided the necessary inclusion rules are met, US Aggregate-eligible securities also contribute to the multi-currency Global Aggregate Index and the US Universal Index. The US Aggregate Index was created in 1986, with history backfilled to January 1, 1976. Bloomberg US Corporate High Yield Bond Index: The Index measures the USD-denominated, high yield, fixed-rate corporate bond market. Securities are classified as high yield if the middle rating of Moody’s, Fitch and S&P is Ba1/BB+/BB+ or below. Bonds from issuers with an emerging markets country of risk, based on the indices’ EM country definition, are excluded. The US Corporate High Yield Index is a component of the US Universal and Global High Yield Indices. The index was created in 1998, with history backfilled to July 1, 1983.
IMPORTANT DISCLOSURES
The views expressed herein are exclusively those of Meeder Investment Management, Inc., are not offered as investment advice, and should not be construed as a recommendation regarding the suitability of any investment product or strategy for an individual’s particular needs. Investment in securities entails risk, including loss of principal. Asset allocation and diversification do not assure a profit or protect against loss. There can be no assurance that any investment strategy will achieve its objectives, generate positive returns, or avoid losses. The performance data shown represents past performance, which does not guarantee future results.
Commentary offered for informational and educational purposes only. Opinions and forecasts regarding markets, securities, products, portfolios, or holdings are given as of the date provided and are subject to change at any time. No offer to sell, solicit, or recommend any security or investment product is intended. Certain information and data has been supplied by unaffiliated third parties as indicated. Although Meeder believes the information is reliable, it cannot warrant the accuracy, timeliness or suitability of the information or materials offered by third parties.
Investment advisory services provided by Meeder Advisory Services, Inc.
©2026 Meeder Investment Management, Inc.
0373-MAS-11/6/26-54666
