You are now leaving Meeder Investment Management. Links to other websites are provided for your convenience and information only. When you click on a link to another website you will be leaving this website. The fact that Meeder Investment Management provides links to other websites does not mean that we endorse, authorize or sponsor the linked website, or that we are affiliated with that website’s owners or sponsors. This material is being provided for informational purposes only and is not a solicitation or an offer to buy any security or to participate in any planning or investment strategy. Unless otherwise indicated, the linked sites are not under our control and we are not responsible for and assume no liability for the content or presentation of any linked site or any link contained in a linked site, or any changes or updates to such sites. We make no representations about the accuracy or completeness of the information contained in any linked sites and their privacy and security policies may differ from ours. We recommend that you review this third-party’s policies and terms carefully.

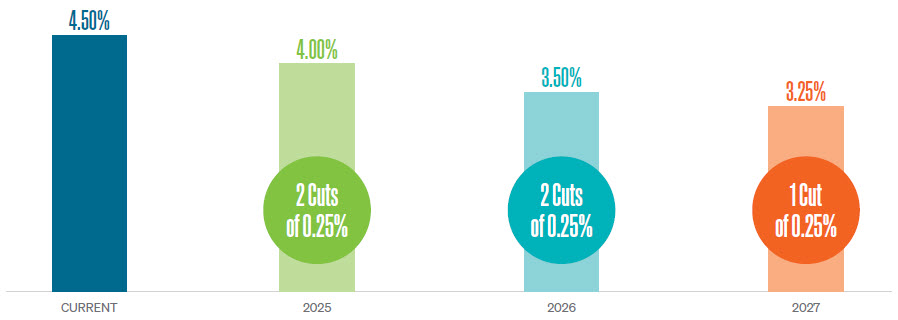
The Federal Reserve released its updated Summary of Economic Projections at its December meeting, which offered a more gradual and extended timeline for interest rate reductions compared to the projections made in September. This outlook signals the Fed’s commitment to balancing price stability with economic growth. While there could always be changes, Figure 4 illustrates the Fed’s current outlook on short-term interest rates to help investors plan accordingly.
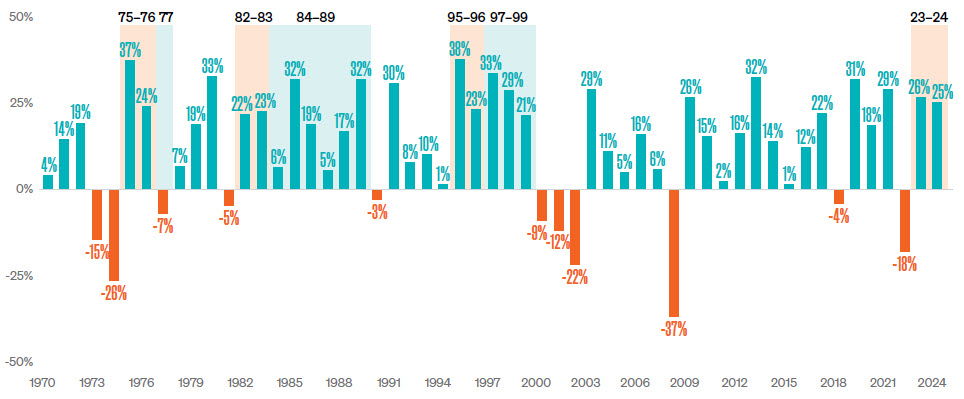
The strong market performance of the past two years provides a solid foundation as we look ahead. History has shown that such periods of robust returns often set the stage for future growth. The resilience of the U.S. economy, bolstered by corporate innovation and strong earnings, remains a key driver of optimism for the year to come.
While challenges remain, the positive momentum generated by strong market leadership and economic adaptability has positioned the U.S. economy and equity markets for continued progress. A disciplined, long-term approach will be critical for navigating short-term uncertainties and capturing the opportunities that lie ahead.
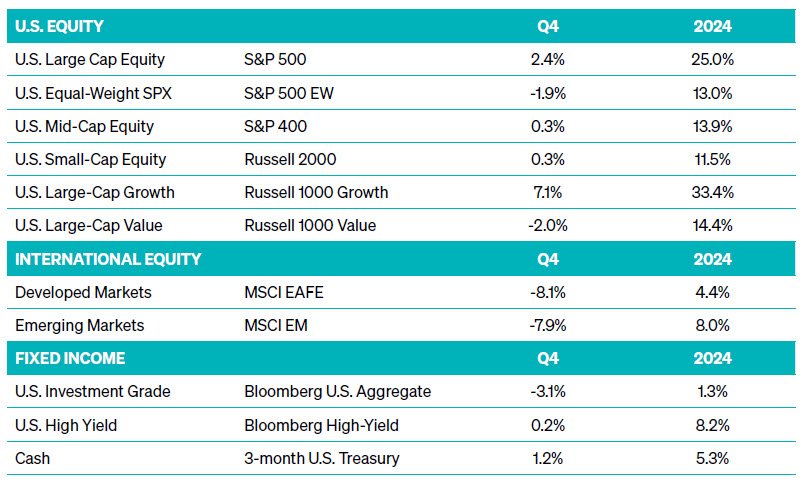
However, the strategy’s allocation to international equities weighed on overall performance relative to its domestic-focused peers. International markets, represented by the MSCI EAFE Index, underperformed with returns of just 4.5%. The MSCI EM Index, representing emerging markets, finished with a gain of 8%. A strengthening U.S. dollar and slower economic growth abroad were key headwinds, reducing the dollar-denominated returns of these holdings. While emerging markets showed signs of stabilization later in the quarter, these gains were not enough to offset the relative underperformance of non-U.S. equities.
The S&P 500 reached new all-time highs early in October, bringing its year-to-date return to over 21%. Risk measures, such as the VIX and MOVE indexes, remained at or below average levels, signaling a low-risk environment. However, as the quarter progressed, expected market volatility increased in anticipation of the November election and the Federal Reserve’s upcoming meetings.
Throughout October, equity markets exhibited robust momentum and breadth, with the S&P 500’s total return index nearing a 25% gain for the year. However, elevated valuations in the context of higher interest rates remained a challenge for the long-term model. Investor sentiment became increasingly bullish during the month, a contrarian indicator that often signals caution. Despite this, overall risk levels remained low, which has historically been a positive driver for equities.
In November, optimism surrounding the U.S. presidential election and expectations of economic policies, such as deregulation and tax cuts, propelled equity markets higher. U.S. indexes reached new all-time highs, and all trend and momentum factors in the short-term model were positive. Market risk measures continued to decline, with the VIX falling well below its long-term average and the MOVE index stabilizing near average levels.
While optimism drove markets higher, contrarian signals, such as bearish options activity and fund flows, contributed positively to the intermediate-term model. By the end of the month, the S&P 500 posted impressive returns, closing at all-time highs. Low market risk and sustained momentum benefitted our fully invested positioning within the Meeder Defensive Equity Strategy.
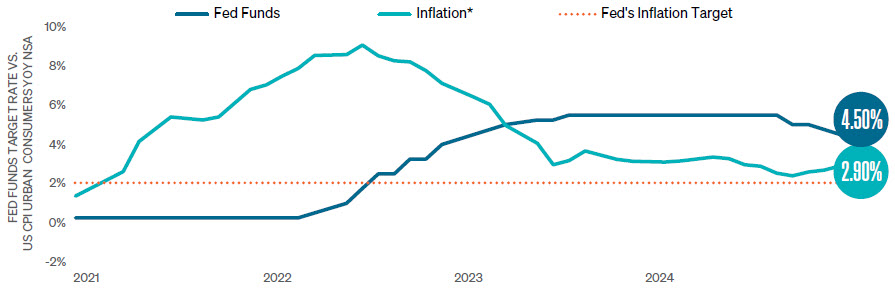
The final month of the year also brought a temporary spike in market volatility following the Federal Reserve’s updated policy outlook. The Fed indicated a more gradual pace of rate cuts in 2025, prompting a pullback in equities and a brief doubling of the VIX. However, markets quickly rebounded after a lower-than-expected inflation report reignited investor optimism. Major indexes recovered by mid-December, the VIX retreated to below-average levels, and the MOVE index remained muted.
As the month progressed, equities remained near or at all-time highs, supported by low risk levels and strong momentum. Bearish sentiment in investor surveys and newsletters—a positive contrarian indicator—further supported the intermediate-term model score. Although elevated valuations and higher bond yields kept the long-term model score in negative territory, the overall outlook for equities remained favorable.
At the start of the quarter, our models identified opportunities in high-yield bonds, prompting an overweight allocation relative to investment-grade debt. This positioning was supported by the Fed’s transition to an easing cycle and a favorable economic backdrop.
In the early part of the quarter, emerging market debt (EMD) also offered attractive opportunities due to a weakening U.S. dollar and positive momentum in the sector. However, as the dollar strengthened in the middle of October, we exited our emerging market debt position, shifting to an underweight stance. Concurrently, as long-term yields rose and the yield curve steepened, we adjusted portfolio duration to a neutral 5.9 years, which was later shortened to 5.0 years by month-end.
Throughout November, we maintained our overweight allocation to high-yield bonds, which continued to benefit from economic growth and declining market volatility. Emerging market debt remained underweight as the strengthening U.S. dollar and rising interest rates created headwinds for the sector. With long-term rates continuing to rise and the curve steepening further, we gradually shortened our portfolio duration to 4.3 years by mid-month and slightly further to 4.2 years by month-end. This shorter duration was a tactical shift from higher rates and inflationary pressures.
Late in November, volatility in emerging market debt eased, and momentum in the sector improved, prompting us to reintroduce a small allocation to EMD. This shift reflected our model’s ability to capture opportunities in dynamic market environments while managing overall portfolio risk.
December brought significant adjustments to our fixed-income strategy as economic and market conditions evolved. Early in the month, we extended the portfolio duration to 5.7 years as long-term yields stabilized, signaling a more favorable environment for longer-duration bonds. At the same time, our overweight allocation to high-yield bonds continued to reflect confidence in the Fed’s easing cycle and economic resilience.
Momentum in emerging market debt remained strong early in the month, reinforcing our modest exposure. However, by mid-December, the strengthening U.S. dollar and rising inflation prompted us to once again exit EMD positions. As inflationary pressures persisted and long-term rates resumed their upward trajectory, we shortened the portfolio duration to 4.3 years and later to 4.2 years to mitigate risk. This adjustment positioned the portfolio to better weather the challenges of a rising rate environment.
S&P 500 Equal Weight Index (EWI): The Index is the equal-weight version of the widely-used S&P 500. The index includes the same constituents as the capitalization-weighted S&P 500, but each company in the S&P 500 EWI is allocated a fixed weight—or 0.2% of the index total at each quarterly rebalance.
Russell 1000 Growth Index: The Index measures the performance of the large-cap growth segment of the US equity universe. It includes those Russell1000 companies with relatively higher price-to-book ratios, higher I/B/E/S forecast medium-term (2 year) growth and higher sales per share historical growth (5 years). The Russell 1000® Growth Index is constructed to provide a comprehensive and unbiased barometer for the large-cap growth segment. The index is reconstituted annually to ensure new and growing equities are included and that the represented companies continue to reflect growth characteristics.
Russell 1000 Value Index: The Index measures the performance of the large-cap value segment of the US equity universe. It includes those Russell 1000 companies with relatively lower price-to-book ratios, lower I/B/E/S forecast medium term (2 year) growth and lower sales per share historical growth (5 years). The Russell 1000® Value Index is constructed to provide a comprehensive and unbiased barometer for the large-cap value segment. The index is completely reconstituted annually to ensure new and growing equities are included and that the represented companies continue to reflect value characteristics
Russell Midcap Index: The Index is a subset of the Russell 1000® Index. It includes approximately 800 of the smallest securities based on a combination of their market cap and current index membership. The Russell Midcap® Index represents approximately 27% of the total market capitalization of the Russell 1000® companies, as of the most recent reconstitution. The Russell Midcap Index is constructed to provide a comprehensive and unbiased barometer for the mid-cap segment. The index is completely reconstituted annually.
Russell 2000 Index: The Index is constructed to provide a comprehensive, unbiased barometer of the small-cap segment of the U.S. equity market. A subset of the Russell 3000 Index, it includes approximately 2,000 of the smallest securities based on a combination of their market cap and current index membership.
MSCI EAFE Index: The Index is an equity index that captures large and mid-cap representation across 21 Developed Markets countries* worldwide, excluding the U.S. and Canada. With 783 constituents, the index covers approximately 85% of each country’s free float-adjusted market capitalization. MSCI EM Index: The Index captures large and mid-cap representation across 24 Emerging Markets (E.M.) countries. With 1,440 constituents, it covers approximately 85% of each country’s free float-adjusted market capitalization.
MSCI EM Index: The Index captures large and mid-cap representation across 24 Emerging Markets (E.M.) countries. With 1,440 constituents, it covers approximately 85% of each country’s free float-adjusted market capitalization.
Bloomberg US Corporate High Yield Bond Index: The Index measures the USD-denominated, high yield, fixed-rate corporate bond market. Securities are classified as high yield if the middle rating of Moody’s, Fitch and S&P is Ba1/BB+/BB+ or below. Bonds from issuers with an emerging markets country of risk, based on the indices’ EM country definition, are excluded. The US Corporate High Yield Index is a component of the US Universal and Global High Yield Indices. The index was created in 1998 with history backfilled to July 1, 1983.
Bloomberg U.S. Aggregate Bond Index: The Index is a broad-based flagship benchmark that measures the investment-grade, U.S. dollar-denominated, fixed-rate taxable bond market. The index includes Treasuries, government-related and corporate securities, fixed-rate agency MBS, ABS, and CMBS (agency and non-agency). Provided the necessary inclusion rules are met, U.S. Aggregate-eligible securities also contribute to the multi-currency Global Aggregate Index and the U.S. Universal Index. The U.S. Aggregate Index was created in 1986, with history backfilled to January 1, 1976.
Commentary offered for informational and educational purposes only. Opinions and forecasts regarding markets, securities, products, portfolios, or holdings are given as of the date provided and are subject to change at any time. No offer to sell, solicitation, or recommendation of any security or investment product is intended. Certain information and data has been supplied by unaffiliated third parties as indicated. Although Meeder believes the information is reliable, it cannot warrant the accuracy, timeliness or suitability of the information or materials offered by third parties.
The views expressed herein are exclusively those of Meeder Investment Management, Inc., are not offered as investment advice, and should not be construed as a recommendation regarding the suitability of any investment product or strategy for an individual’s particular needs. Investment in securities entails risk, including loss of principal. Asset allocation and diversification do not assure a profit or protect against loss. There can be no assurance that any investment strategy will achieve its objectives, generate positive returns, or avoid losses.
Investors cannot invest directly in an index. The performance of any index is not indicative of the performance of any investment and does not take into account the effects of inflation and the fees and expenses associated with investing.
Investment advisory services offered by Meeder Advisory Services, Inc.
©2025 Meeder Investment Management, Inc.
0289-MAS-1/22/25-48066