You are now leaving Meeder Investment Management. Links to other websites are provided for your convenience and information only. When you click on a link to another website you will be leaving this website. The fact that Meeder Investment Management provides links to other websites does not mean that we endorse, authorize or sponsor the linked website, or that we are affiliated with that website’s owners or sponsors. This material is being provided for informational purposes only and is not a solicitation or an offer to buy any security or to participate in any planning or investment strategy. Unless otherwise indicated, the linked sites are not under our control and we are not responsible for and assume no liability for the content or presentation of any linked site or any link contained in a linked site, or any changes or updates to such sites. We make no representations about the accuracy or completeness of the information contained in any linked sites and their privacy and security policies may differ from ours. We recommend that you review this third-party’s policies and terms carefully.
Investors with stock market exposure to the S&P 500 index experienced a decline of -18%, the worst-performing year since the Great Financial Crisis in 2008. On the other end of the risk spectrum, fixed-income investments typically achieve
positive returns when stocks experience downturns. Although it is common for the Bloomberg U.S. Aggregate Bond index to have intra-year declines in negative territory, there have only been five years where the index has produced a negative
total return since 1976. This year the Bloomberg U.S. Aggregate Bond Index total return fell more than -13%, making it the worst-performing year for the index. The next worst-performing year occurred in 1994 when the index fell nearly -3%.

While the supply chain and rising energy costs contributed to inflation, its impact paled in comparison to Congress’ spending initiatives that included stimulus payments to help those companies and individuals that suffered financially due to the COVID-19 global pandemic. These spending packages injected trillions of dollars into the financial system and added tremendous liquidity, ultimately accelerating inflation to reach a 40-year high.
The energy sector contributed to inflation as it produced extraordinarily high returns due to concerns about a shrinking global oil supply after Russian troops invaded Ukraine. Russia is the third largest exporter of oil and petroleum products to the U.S. The removal of this supply caused oil prices to surge to more than $120 a barrel. According to AAA, gasoline prices reached their highest recorded U.S. national average price per gallon at $5.01.
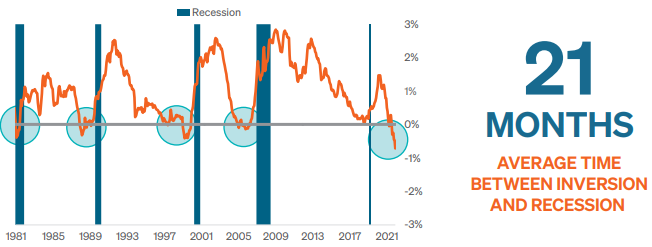
The two most common maturities that investors compare are the 2- and 10-year Treasuries. When the yield of the shorter-term maturity exceeds the long-term, the yield curve is said to be inverted. An inverted yield curve has historically been a precursor to a recession in the U.S. economy. Since its inversion in 1988, the average time from the initial yield curve inversion to the time of a recession is 21 months, as shown in Figure 2.
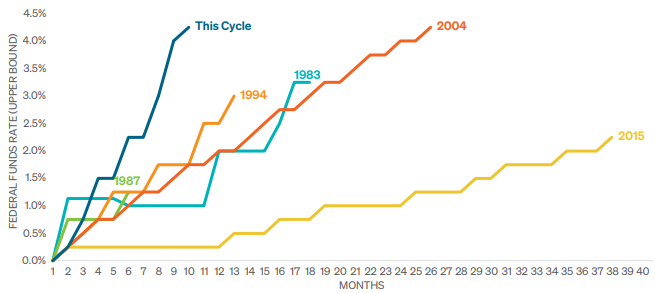
In the fourth quarter, inflation retreated from a 40-year high but remained stubbornly high. The Federal Reserve raised interest rates twice in the fourth quarter for a total of seven hikes in 2022. The Fed provided guidance, agreeing to slow the pace of future short-term rate increases. The guidance helped equity performance rebound in the fourth quarter but remained down significantly for the year. Rising rates lower the present value of future earnings; therefore, the appetite for growth stocks became much less attractive as yields soared. Investors with positions in Growth Strategy portfolios achieved returns and experienced market volatility similar to that of the broader stock market in the fourth quarter.
At the beginning of the fourth quarter, the IPS model indicated that we should have an equity target exposure of 41%. By the middle of October, the long-term model score worsened due to deteriorating global macro trends and weaker momentum. These factors guided us to reduce the equity exposure to 31%, marking the lowest level for the quarter.
In early November, we increased our exposure to 45% as the intermediate-term model score strengthened due to improvements in sentiment and consumer demand factors. Near the end of the month, expectations for a reduction in the pace of interest rate increases improved our investment model scores, and we increased our stock market exposure to 57%.
Equity markets declined throughout December as the Federal Funds rate climbed to its highest point since 2007. Inflation remained stubbornly high, weakening our long-term model score, as these interest rate environments have historically been challenging for equities. The model signaled that we should reduce our exposure to 51% at the end of 2022.
The beginning of the quarter saw the credit models pointing towards weakness in credit sectors and a short-duration positioning. Therefore, the portfolio began early in the quarter without exposure to high-yield or emerging market sectors. A sizeable defensive position remained as increased volatility persisted in the bond market. Spreads began to compress toward the end of the month, and the credit model turned to risk-on.
As volatility subsided early in November the model switched to risk-on, therefore, we added exposure in the high-yield and emerging market sectors. By the end of the month, exposure was increased to both sectors and duration to get closer to a neutral position.
any factors for the sector models remained risk-on into December and led the portfolio to maintain exposure to high-yield and emerging markets. The investment-grade bond allocation was the main driver in duration for the portfolio and remained steady throughout the quarter. Near the end of the year, the models reversed course and turned to risk-off for the spread sectors. The strategy marginally reduced the exposure to high yield and increased their cash allocation.
Sincerely,
ROBERT S. MEEDER
PRESIDENT AND CEO
The views expressed herein are exclusively those of Meeder Investment Management, Inc., are not offered as investment advice, and should not be construed as a recommendation regarding the suitability of any investment product or strategy for an individual’s particular needs. Investment in securities entails risk, including loss of principal. Asset allocation and diversification do not assure a profit or protect against loss. There can be no assurance that any investment strategy will achieve its objectives, generate positive returns, or avoid losses.
Commentary offered for informational and educational purposes only. Opinions and forecasts regarding markets, securities, products, portfolios, or holdings are given as of the date provided and are subject to change at any time. No offer to sell, solicitation, or recommendation of any security or investment product is intended. Certain information and data has been supplied by unaffiliated third parties as indicated. Although Meeder believes the information is reliable, it cannot warrant the accuracy, timeliness or suitability of the information or materials offered by third parties.
Investment advisory services provided by Meeder Asset Management, Inc.
©2022 Meeder Investment Management, Inc.
0107-MIM-1/12/23-30813
