You are now leaving Meeder Investment Management. Links to other websites are provided for your convenience and information only. When you click on a link to another website you will be leaving this website. The fact that Meeder Investment Management provides links to other websites does not mean that we endorse, authorize or sponsor the linked website, or that we are affiliated with that website’s owners or sponsors. This material is being provided for informational purposes only and is not a solicitation or an offer to buy any security or to participate in any planning or investment strategy. Unless otherwise indicated, the linked sites are not under our control and we are not responsible for and assume no liability for the content or presentation of any linked site or any link contained in a linked site, or any changes or updates to such sites. We make no representations about the accuracy or completeness of the information contained in any linked sites and their privacy and security policies may differ from ours. We recommend that you review this third-party’s policies and terms carefully.

However, not all economic indicators were positive. The ISM Manufacturing PMI in September was 47.2, the same as August and signaling an ongoing contraction in the manufacturing sector. This result contrasted with the ISM Services PMI, which rose to 54.9 in September, its highest level since February 2023. The divergence between manufacturing and services highlights the uneven nature of the economic recovery, with the services sector benefiting more from consumer demand.
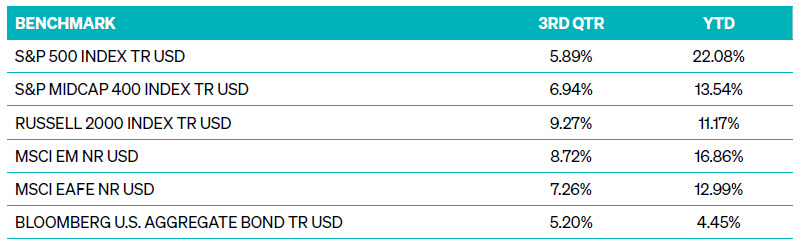
High-yield bonds extended their outperformance, supported by narrowing credit spreads and strong corporate fundamentals. Investment-grade bonds also posted gains during the rate-cutting period, though rising yields in the latter part of the quarter capped some of these gains. Bond investors continue to weigh the benefits of lower short-term rates against the risk of stickier long-term inflation.
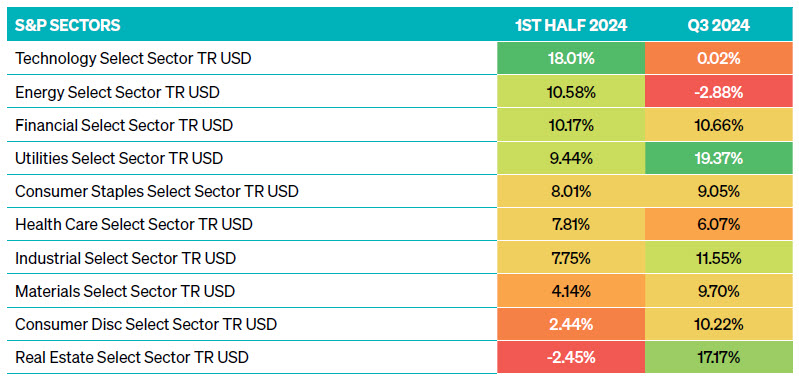
Sectors that previously underperformed due to higher interest rates, such as real estate, utilities, and consumer staples, experienced a strong resurgence. Real estate and utilities posted gains of over 17%, benefiting from lower borrowing costs and renewed investor confidence. In contrast, technology stocks, which had led the market in the first half of the year, saw a slowdown, with the information technology sector delivering a modest 0.2% return.
As the Federal Reserve prepares for further rate cuts, the Growth Strategy is well-positioned to capture opportunities across sectors benefiting from shifting market dynamics. With a tactical focus on adapting to evolving economic conditions, the strategy remains poised to navigate opportunities in companies that thrive in a more favorable accommodative monetary environment. Investors in the Meeder Growth Strategy experienced more volatility than other strategies this quarter, but those who remained invested achieved the highest returns in our portfolio suite.
At the end of June, the Meeder Defensive Equity Strategy held a 95% net equity exposure, balancing the challenges of elevated valuations, inflation, and restrictive interest rates, which kept the long-term model score in negative territory. However, bearish fund flows and positive U.S. economic sentiment bolstered the intermediate-term model. Market risk remained notably low, with equity and interest rate volatility near 5-year lows, supporting a high equity allocation.
By early July, we reduced equity exposure to 91% due to ongoing pressure from elevated valuations and declining sub-industry momentum. The long-term model continued to reflect these headwinds, but bearish fund flows remained positive from a contrarian perspective for the intermediate-term outlook. Following a softer-than-expected CPI report in mid-July, we increased equity exposure to 100%. A surge in market breadth, particularly in smaller-cap stocks, alongside continued low market volatility, further strengthened the long-term and intermediate-term model scores.
The strategy maintained an equity exposure of 100% throughout late July and August as market risk remained subdued. Despite an uptick in volatility in early August due to concerns over the U.S. labor market, the long-term model score improved as market breadth and momentum strengthened. The intermediate-term model remained strong, supported by bearish sentiment indicators like fund flows and options activity. Both equity and bond market volatility as measured by the VIX and MOVE indexes, respectively, retraced to lower levels by mid-August, reinforcing the positive outlook for equities.
Throughout September, the Meeder Defensive Equity Strategy maintained 100% net equity exposure as the long-term model score continued improving, supported by strong momentum in domestic and international equity markets. A 50-basis point Fed rate cut helped propel the S&P 500 to new all-time highs, further boosting the long-term outlook for stocks. The intermediate-term model remained neutral, with bullish investor sentiment balanced by bearish fund flows. Expected equity market volatility (VIX) is now below its 5-year average, creating a favorable environment for equities. This reduction remains the main driver of our 100% equity allocation.
The Fixed Income Strategy began the third quarter with an overweight position in high yield relative to investment-grade debt. The carry (yield) on high yield remained attractive as the outlook for capital appreciation in higher-quality bonds was limited. We also maintained an overweight in emerging market debt, benefiting from reduced market volatility. Meanwhile, our duration stance remained neutral due to uncertainty surrounding a potential Fed rate cut in September, which had a 65–75% probability at the time.
In mid-July, the certainty around a September rate cut further increased, leading us to extend the portfolio duration to about one year longer than the Bloomberg Aggregate Index. High yield spreads tightened, reflecting continued economic strength, and our overweight in emerging market debt benefited from a weakening U.S. dollar and positive momentum. With a 25-basis point rate cut fully priced in, the market anticipated further rate cuts through the remainder of 2024.
In August, we saw some volatility in high-yield spreads, widening briefly before rallying again. Despite this, the sector remained favorable due to mean-reverting factors. We continued to be overweight in emerging market debt as the dollar weakened further, supporting this position. Toward the end of August, we returned to a neutral duration stance after the yield curve steepened, with short-term rates dropping faster than long-term rates.
The Fed started relaxing monetary policy in September with a 50-basis point cut. We maintained our overweight in high yield as spreads improved, and the carry remained attractive. Our emerging market debt position continued to benefit from weakness in the U.S. dollar. The portfolio’s duration remained neutral as the yield curve steepened further, signaling a more normal rate environment with two-year yields below ten-year yields, positioning us well for the remainder of the year.
INDEX DESCRIPTIONS
Russell 1000 Growth: The index measures the performance of the large-cap growth segment of the US equity universe. It includes those Russell 1000 companies with relatively higher price-to-book ratios, higher I/B/E/S forecast medium-term (2 year) growth and higher sales per share historical growth (5 years). The index is completely reconstituted annually.
S&P 500 Growth Index: The Index measures constituents from the S&P 500 that are classified as growth stocks based on three factors: sales growth, the ratio of earnings change to price, and momentum.
S&P 500 Index: The Index tracks the stock performance of 500 of the largest companies listed on stock exchanges in the United States. It is one of the most followed equity indices and includes approximately 80% of the total market capitalization of U.S. public companies.
S&P 500 Value Index: The index measures constituents from the S&P 500 that are classified as value stocks based on three factors: the ratios of book value, earnings and sales to price.
Russell 1000 Value Index: The index measures the performance of the large-cap value segment of the US equity universe. It includes those Russell 1000 companies with relatively lower price-to-book ratios, lower I/B/E/S forecast medium-term (2 years) growth, and lower sales per share historical growth (5 years). The index is completely reconstituted annually.
S&P 400 MidCap Growth Index: The index measures constituents from the S&P MidCap 400 that are classified as growth stocks based on three factors: sales growth, the ratio of earnings change to price, and momentum
S&P 400 MidCap Index: This index gauges the U.S. mid-cap equities sector and is the most widely followed mid-cap index. To be included in the index, a stock must have a total market capitalization between $5.8 billion and $15.8 billion.
S&P 400 MidCap Value Index: The index measures constituents from the S&P MidCap 400 that are classified as value stocks based on three factors: the ratios of book value, earnings and sales to price.
Russell 2000 Growth Index: The Index measures the performance of the small-cap growth segment of the US equity universe. It includes those Russell 2000 companies with relatively higher price-to-book ratios, higher l/B/E/S forecast medium term (2 year) growth and higher sales per share historical growth (5 years). The Russell 2000 Growth Index is constructed to provide a comprehensive and unbiased barometer for the small-cap growth segment. The index is completely reconstituted annually to ensure new and growing equities are included and that the represented companies continue to reflect growth characteristics.
Russell 2000 Index: The Index is constructed to provide a comprehensive, unbiased barometer of the small-cap segment of the U.S. equity market. A subset of the Russell 3000 Index, it includes approximately 2,000 of the smallest securities based on a combination of their market cap and current index membership.
Russell 2000 Value Index: The Index measures the performance of the small-cap value segment of the US equity universe. It includes those Russell 2000 companies with relatively lower price-to-book ratios, lower I/B/E/S forecast medium term (2 year) growth and lower sales per share historical growth (5 years). The Russell 2000 Value Index is constructed to provide a comprehensive and unbiased barometer for the small-cap value segment. The index is completely reconstituted annually to ensure new and growing equities are included and that the represented companies continue to reflect value characteristics.
MSCI EAFE Index: The Index is an equity index that captures large and mid-cap representation across 21 Developed Markets countries* worldwide, excluding the U.S. and Canada. With 783 constituents, the index covers approximately 85% of each country’s free float-adjusted market capitalization.
MSCI EM Index: The Index captures large and mid-cap representation across 24 Emerging Markets (E.M.) countries. With 1,440 constituents, it covers approximately 85% of each country’s free float-adjusted market capitalization.
Bloomberg US Aggregate Bond Index: The Index is a broad-based flagship benchmark that measures the investment-grade, U.S. dollar-denominated, fixed-rate taxable bond market. The index includes Treasuries, government-related and corporate securities, fixed-rate agency MBS, ABS, and CMBS (agency and non-agency). Provided the necessary inclusion rules are met, U.S. Aggregate-eligible securities also contribute to the multi-currency Global Aggregate Index and the U.S. Universal Index. The U.S. Aggregate Index was created in 1986, with history backfilled to January 1, 1976
S&P Utilities Select Sector: The Index comprises those companies included in the S&P 500 that are classified as members of the GICS® utilities sector.
S&P Technology Select Sector: The Index comprises those companies included in the S&P 500 that are classified as members of the GICS® technology sector.
S&P Real Estate Select Sector: The Index comprises those companies included in the S&P 500 that are classified as members of the GICS® real estate sector.
S&P Materials Select Sector: The Index comprises those companies included in the S&P 500 that are classified as members of the GICS® materials sector.
S&P Industrial Select Sector: The Index comprises those companies included in the S&P 500 that are classified as members of the GICS® industrials sector.
S&P Health Care Select Sector: The Index comprises those companies included in the S&P 500 that are classified as members of the GICS® health care sector.
S&P Financial Select Sector: The Index comprises those companies included in the S&P 500 that are classified as members of the GICS® financials sector.
S&P Energy Select Sector: The Index comprises those companies included in the S&P 500 that are classified as members of the GICS® energy sector.
S&P Consumer Disc Select Sector: The Index comprises those companies included in the S&P 500 that are classified as members of the GICS® consumer discretionary sector.
S&P Cons Staples Select Sector: The Index comprises those companies included in the S&P 500 that are classified as members of the GICS® consumer staples sector.
The views expressed herein are exclusively those of Meeder Investment Management, Inc., are not offered as investment advice, and should not be construed as a recommendation regarding the suitability of any investment product or strategy for an individual’s particular needs. Investment in securities entails risk, including loss of principal. Asset allocation and diversification do not assure a profit or protect against loss. There can be no assurance that any investment strategy will achieve its objectives, generate positive returns, or avoid losses.
Commentary offered for informational and educational purposes only. Opinions and forecasts regarding markets, securities, products, portfolios, or holdings are given as of the date provided and are subject to change at any time. No offer to sell, solicitation, or recommendation of any security or investment product is intended. Certain information and data has been supplied by unaffiliated third parties as indicated. Although Meeder believes the information is reliable, it cannot warrant the accuracy, timeliness or suitability of the information or materials offered by third parties.
Investment advisory services provided by Meeder Asset Management, Inc.
©2024 Meeder Investment Management, Inc.
0116-MAM-10/18/24-46006