You are now leaving Meeder Investment Management. Links to other websites are provided for your convenience and information only. When you click on a link to another website you will be leaving this website. The fact that Meeder Investment Management provides links to other websites does not mean that we endorse, authorize or sponsor the linked website, or that we are affiliated with that website’s owners or sponsors. This material is being provided for informational purposes only and is not a solicitation or an offer to buy any security or to participate in any planning or investment strategy. Unless otherwise indicated, the linked sites are not under our control and we are not responsible for and assume no liability for the content or presentation of any linked site or any link contained in a linked site, or any changes or updates to such sites. We make no representations about the accuracy or completeness of the information contained in any linked sites and their privacy and security policies may differ from ours. We recommend that you review this third-party’s policies and terms carefully.
Q2 2026 Quarterly Perspectives

» The second quarter reversed sharply from the extreme pessimism of early April, with the S&P 500 returning 15.2%—its strongest quarterly gain since the 2020 COVID recovery.
» Sentiment extremes in April closely mirrored prior crisis episodes; the resulting 14% three-month rally matched the historical average for such readings almost exactly.
» A new Fed Chair delivered a more hawkish tone than markets expected, but incoming data on oil, prices, and jobs suggests a policy hold may be more likely than current pricing implies.
» Earnings growth, not multiple expansion, powered 2026’s equity gains, reinforcing a durable fundamental backdrop beneath the quarter’s volatility.
Navigating the Crossroads: Rates, Recovery, and a New Fed Era
The second quarter of 2026 opened in a state of acute investor anxiety and closed as one of the strongest quarters for U.S. equities since the COVID recovery. The S&P 500 returned 15.2% for the quarter—its best showing since the second quarter of 2020—while small-cap and emerging market equities posted even stronger gains of 21.6% and 24.1%, respectively. For long-term investors, the story of the quarter is not the volatility that preceded it, but how quickly markets moved from extreme pessimism to broad, earnings-driven strength.
Extreme Fear Preceded a Historic Reversal
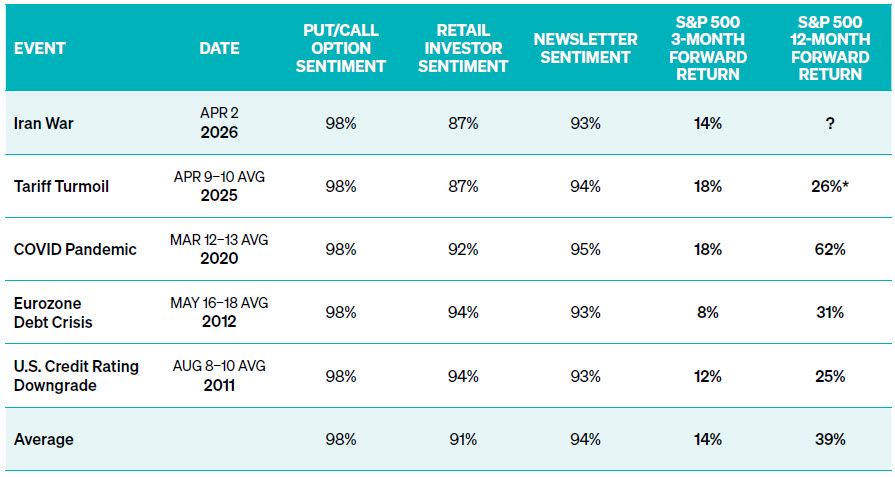
Entering April, investor sentiment had reached some of the most bearish levels in over two decades. Retail survey sentiment stood in the 87th percentile of bearishness, newsletter sentiment reached 93%, and put/call options sentiment approached 98%—readings comparable to prior periods of acute stress, including the 2011 U.S. credit rating downgrade, the 2012 Eurozone debt crisis, the 2020 COVID pandemic, and the 2025 tariff turmoil. Historically, similarly extreme readings have preceded average S&P 500 gains of 14% over the following three months and 39% over the following year.
HISTORY REPEATED ITSELF
December 13, 1999 – July 7, 2026
SOURCE: BLOOMBERG, AAII AS OF JUL-26. THE PERFORMANCE DATA SHOWN REPRESENTS PAST PERFORMANCE, WHICH DOES NOT GUARANTEE FUTURE RESULTS. AVERAGE MAY
NOT TOTAL DUE TO ROUNDING.
History, in this instance, repeated almost exactly. From April 2 through July 2, the S&P 500 returned 14%—matching the historical average precisely. As the rally unfolded, sentiment cooled from its extremes but has not swung to excessive optimism: retail sentiment remains elevated at the 82nd percentile of bearishness, while newsletter sentiment eased meaningfully to the 31st percentile and put/call sentiment moved to 69%. In our view, the absence of euphoria—even after a rally of this magnitude—remains a constructive signal.
Rising rates and elevated volatility made fixed income positioning consequential in the first half of the year. The Bloomberg U.S. Aggregate Index returned just 0.62% through June, weighed down by a rate backdrop shaped first by geopolitical- and inflation-related concerns and later by the market’s hawkish read on the new Fed Chair. Shorter-duration positioning and allocations to higher-yielding segments were additive: 1- to 3-month Treasury bills returned 1.80%, U.S. high yield returned 1.966%, and emerging market debt was the standout, returning 2.61%.
A New Chair, A New Tone
Monetary policy took on a new dimension as Kevin Warsh held his first FOMC meeting and press conference as Fed Chair on June 17. Heading into the meeting, markets were positioned for a relatively dovish transition: zero to one rate hike priced for 2026, balance sheet policy on autopilot, and expectations that Warsh would lean dovish. The actual outcome was materially more hawkish. Warsh reopened the door to balance sheet reduction, and repeated the phrase “price stability” twelve times in his opening press conference, describing the Committee’s commitment to price stability as “unanimous and unambiguous.” The two-year Treasury yield jumped 16 basis points on the day—the largest FOMC-day move since March 2008—and markets now price roughly 60% odds of a hike at the September meeting.
Yet the incoming data tells a more complicated story than the market’s hawkish repricing might suggest.
Oil prices have declined steadily since their spring peak, ISM manufacturing prices paid have come in
below expectations for two consecutive months, and June payroll growth was lackluster at just 57,000 jobs, with the three-month average now at 122,000—a historically soft level. Looking back to 1970, the Fed has raised rates within six months of such weak job growth only about 22% of the time, versus 52% of the time when job growth exceeds 200,000. Taken together, we believe a policy hold is more likely than current market pricing implies.
Earnings is Doing the Heavy Lifting, While Market Breadth is Broadening
The composition of 2026’s equity returns has been unusually clean. Despite the quarter’s rally, valuations
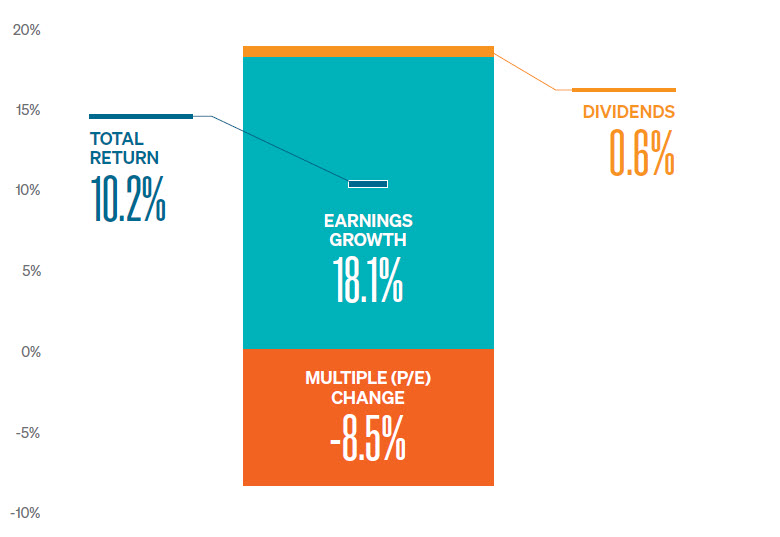
actually compressed: the forward 12-month S&P 500 price-to-earnings ratio finished the first half 8.5% lower than where it started the year. Earnings growth of 18.1% year-to-date, plus a modest dividend contribution of 0.6%, accounts for all of the index’s 10.2% year-to-date total return. This is a market advancing on the strength of earnings momentum rather than one climbing on multiple expansion or fear of missing out.
EARNINGS GROWTH IS POWERING 2026 EQUITY RETURNS
S&P 500 Total Return Decomposition (as of 6/30/26)
SOURCE: FACTSET, CARSON INVESTMENTS, AS OF JUN-26. THE PERFORMANCE DATA SHOWN REPRESENTS PAST PERFORMANCE, WHICH DOES NOT GUARANTEE FUTURE RESULTS
One of the most encouraging developments of the past year has also been the steady improvement in market breadth. The NYSE Cumulative Advance-Decline Line—a measure of how many stocks are advancing versus declining—has moved to new highs even as the S&P 500 itself has spent stretches consolidating. This kind of divergence, with breadth leading price rather than lagging it, has historically been associated with healthier, more durable market advances. Brief pullbacks in breadth during late April and mid-May resolved quickly; we would want to see a divergence persist for several months—as it did, for example, from 1998 into 2000—before treating it as a genuine warning sign.
Portfolio Positioning
Our Defensive Equity Strategy carried a 97% average equity allocation through the second quarter and was nearly fully invested for most of the period, allowing portfolios to participate in the rally. Our quantitative reward/risk framework continues to support that positioning: market risk remains low relative to history—in the bottom quintile of readings since 1990—even though elevated valuations and inflation keep the reward signal from registering as strongly positive as breadth and momentum alone would suggest. Within equities, sector positioning remains overweight information technology, financials, healthcare, and industrials, with underweights in consumer discretionary, consumer staples, and energy; a modest allocation to developed international and emerging markets rounds out the global exposure.
Credit markets, however, are beginning to send a more nuanced signal. U.S. high yield spreads remain near their tightest levels in history at 2.7%—not far from the 2007 low of 2.3%—meaning investors are being paid relatively little to take on credit risk. At the same time, the volatility of those spreads has picked up to its highest level since March 2026. In response, we trimmed high yield exposure meaningfully, from an average 30% allocation in the first half to 13% entering the third quarter, while extending duration to 5.7 years and maintaining a 7% allocation to emerging market debt.
Looking Ahead
Volatility With a Constructive Foundation
As markets move into the second half of 2026, we face a new, less predictable Fed communication
style, lingering geopolitical uncertainty in the Middle East, and the approach of the November midterm
elections. History offers useful, if imperfect, context on the latter: the president’s party has lost House
seats in nearly every midterm since 1934, and midterm years have historically produced an average
drawdown of 17% followed by an average 12-month recovery of 32% off the low. As always, we would
caution against letting political views drive portfolio decisions—allowing politics to influence long-term
investment strategy is rarely a sound approach.
Set against that backdrop, the fundamental picture remains constructive: earnings growth is strong,
market breadth is healthy and leading price, credit conditions—while tighter—are not exhibiting
systemic stress, and investor sentiment has not swung to complacency even after a powerful rally.
As always, Meeder’s investment process remains focused on diversification, risk management, and
adapting systematically as conditions evolve.
INDEX DESCRIPTIONS
Investors cannot invest directly in an index. The performance of any index is not indicative of the performance of any investment and does not take into account the effects of inflation and the fees and expenses associated with investing.
S&P 500® Index: A market-capitalization-weighted index of 500 leading U.S. large-cap companies. It is one of the most widely followed benchmarks for the performance of the U.S. equity market. S&P 500 Total Return Index (SPTR): A market-capitalization-weighted index that tracks the performance of the stocks in the S&P 500 and assumes that all cash dividends distributed by constituent companies are reinvested, providing a measure of the index’s total return (capital appreciation plus dividend income). Bloomberg U.S. Aggregate Bond Index: A broad benchmark that measures the performance of the U.S. investment-grade taxable bond market, including U.S. Treasuries, government-related securities, corporate bonds, mortgage-backed securities, asset-backed securities, and commercial mortgage-backed securities. U.S. Treasury Bills (1- to 3-Month): Represents the performance of short-term U.S. Treasury securities with maturities between one and three months. Treasury bills are backed by the full faith and credit of the U.S. government and are commonly used as a measure of short-term cash returns. NYSE Cumulative Advance-Decline Line: A market breadth indicator that cumulatively tracks the daily difference between the number of advancing and declining stocks listed on the New York Stock Exchange (NYSE). It is used to assess the overall participation in market advances or declines.
Commentary offered for informational and educational purposes only. Opinions and forecasts regarding markets, securities, products, portfolios, or holdings are given as of the date provided and are subject to change at any time. No offer to sell, solicit, or recommend any security or investment product is intended. Certain information and data has been supplied by unaffiliated third parties as indicated. Although
Meeder believes the information is reliable, it cannot warrant the accuracy, timeliness or suitability of the information or materials offered by third parties.
The views expressed herein are exclusively those of Meeder Investment Management, Inc., are not offered as investment advice, and should not be construed as a recommendation regarding the suitability of any investment product or strategy for an individual’s particular needs. Investment in securities entails risk, including loss of principal. Asset allocation and diversification do not assure a profit or protect against loss. There can be no assurance that any investment strategy will achieve its objectives, generate positive returns, or avoid losses.
Investment advisory services offered by Meeder Advisory Services, Inc.
©2026 Meeder Investment Management, Inc.
0289-MAS-7/16/26-53926