You are now leaving Meeder Investment Management. Links to other websites are provided for your convenience and information only. When you click on a link to another website you will be leaving this website. The fact that Meeder Investment Management provides links to other websites does not mean that we endorse, authorize or sponsor the linked website, or that we are affiliated with that website’s owners or sponsors. This material is being provided for informational purposes only and is not a solicitation or an offer to buy any security or to participate in any planning or investment strategy. Unless otherwise indicated, the linked sites are not under our control and we are not responsible for and assume no liability for the content or presentation of any linked site or any link contained in a linked site, or any changes or updates to such sites. We make no representations about the accuracy or completeness of the information contained in any linked sites and their privacy and security policies may differ from ours. We recommend that you review this third-party’s policies and terms carefully.
Q2 2025 Quarterly Perspectives

Tariffs Define the Quarter
Trade policy took center stage during the second quarter of 2025, sparking historic market swings, reigniting concerns about inflation, and prompting questions about the economic outlook. Equity markets were whipsawed by tariff announcements, partial reversals, and fragile global negotiations, all while inflation data and corporate earnings sent conflicting signals.
The quarter began with a shock. On April 2, the U.S. government unveiled an expansive tariff plan, titled “Liberation Day,” aimed at restoring American competitiveness. A blanket 10% tariff was introduced, with significantly higher rates—up to 145%—targeting key strategic partners, such as China. Markets, caught off guard by both the scale and scope, reacted with intense selling pressure. The S&P 500 fell over 10% in just two trading days (April 2–4), a decline matched only three times since 1952.
A surprise policy reversal soon followed. On April 9, the administration paused most tariffs (excluding those on China) for 90 days. That triggered the largest single-day gain in the S&P 500 since 2008, surging 9.5%. Still, uncertainty lingered, and volatility remained elevated.
At the same time, signs of capitulation began to surface in market sentiment indicators. According to the AAII Weekly Survey, 62% of respondents were bearish as of early April, levels rarely seen outside of major market troughs. Historically, such extreme readings have often preceded turning points, particularly when paired with heightened volatility and indiscriminate selling.
Market Performance Snapshot
Despite experiencing a sharp correction early in the quarter, markets staged a historic recovery. Throughout April and May, signs of progress began to emerge. The U.S. and China temporarily agreed to reduce tariffs—U.S. rates fell from 145% to 30%, while China cut its tariffs on U.S. goods from 125% to 10%. Other trade negotiations continued in parallel. Tariffs on European imports were delayed until July 9, offering more time for diplomacy.
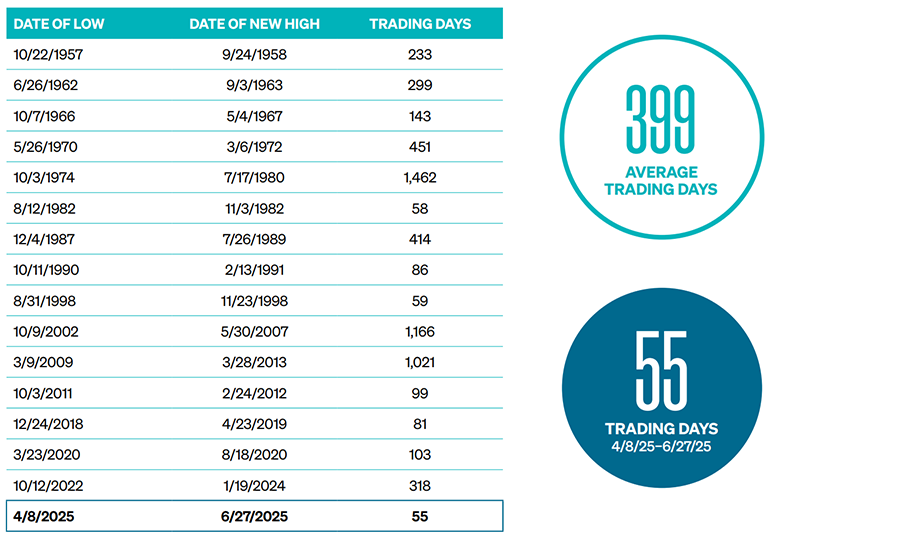
Amidst the descalation of the tariff war, the S&P 500 Index surged 24% from its April low, marking the fastest rebound on record for a drawdown of that magnitude (see Figure 1). Since 1950, declines of 19% or more took an average of 399 trading days to reach a new all-time high. The rebound that began on April 9th set a record as the fastest since 1950 to reach a new all-time high in just 55 trading days.
FIGURE 1
FASTEST RECOVERY ON RECORD
Number of trading days to reach new highs following > -19% drawdowns in S&P 500 (since 1950)
Despite early-quarter turmoil, several catalysts emerged that supported the V-bottom recovery. These included signs of progress in tariff negotiations, a partial policy reversal by the Trump administration, and easing inflation data. Combined with extreme bearish sentiment, these factors provided fertile ground for a sharp market rebound, helping to drive market resilience following the April correction.
From a performance perspective, large-cap growth and international equities led the way. These results reflect an improvement in investor sentiment, a bounce-back in market breadth, and the fading of peak policy and geopolitical risks. Notably, the U.S. dollar weakened significantly during the quarter, falling 11% year-to-date. The decline in the U.S. dollar helped support strong international equity returns, with the MSCI EAFE and MSCI EM indices gaining 19.9% and 15.5%, respectively. The Q1 earnings season closed with S&P 500 companies posting 13.3% year-over-year growth, well above 9% expectations. Strength in Technology and Utilities helped offset weakness in Energy, which struggled alongside falling oil prices. As market momentum improved and volatility eased, investor confidence began to rebound.
FIGURE 2
2025 ASSET CLASS RETURNS
YTD as of June 30, 2025

Additionally, bond market indicators provided confirmation that macroeconomic conditions were improving. The yield curve steepened, which is typically a signal of rising growth expectations from investors, and was accompanied by low high-yield credit spreads. While uncertainty remains, investors appear increasingly willing to look through short-term volatility in favor of longer-term fundamentals.
Signs of Economic Stability Emerge
The Fed maintained its benchmark interest rate at 4.25%–4.50% throughout the quarter. Chair Jerome Powell emphasized the importance of following the data amid the political noise and tariff-driven headlines. Inflation was mixed, as the annual PCE rose 2.3% in May, as expected, but forward-looking indicators suggest lingering risks.
GDP declined by an annualized -0.2% in Q1, driven by a surge in imports ahead of the April tariff announcement. However, domestic demand remained strong, growing at a 3% pace excluding trade, inventories, and government spending. Labor markets remained stable, with May payrolls increasing by 139,000 and unemployment remaining steady at 4.2%.
Market risk indicators, such as credit spreads and implied volatility, peaked in early April but began to trend lower into June, suggesting that the worst of the policy shock may have passed.
Additional economic data reinforced the theme of a slowing but resilient economy. The ISM Manufacturing PMI for June came in at 49, slightly above May’s reading (48.5) and consensus expectations (48.8). In contrast, the April JOLTs report showed job openings rising to 7.77 million, exceeding both the prior month (7.2 million) and expectations (7.10 million)—a signal of persistent labor market strength.
Tensions Erupt in the Middle East
Geopolitical tensions surged in June when Israel conducted a large-scale airstrike campaign on Iran. In a surprise early morning assault on June 13, over 200 Israeli jets and drones struck multiple Iranian targets, including uranium facilities and military command centers. The strike marked one of the most significant direct hits on Iran’s military infrastructure in decades, resulting in the death of at least 20 senior IRGC officers and six nuclear scientists.
Markets reacted swiftly. Oil prices spiked more than 9%, briefly topping $75 per barrel on concerns about potential disruption in the Strait of Hormuz. Gold neared record highs as investors sought safe havens. Equities broadly declined, particularly in airline and industrial sectors, while Treasury yields fell as investors rotated into safer assets.
Tensions escalated further late in the quarter when the United States conducted a limited but highly targeted military strike in Iran. On June 28, U.S. forces launched precision airstrikes against key missile facilities and suspected drone launch sites believed to be linked to prior attacks on U.S. assets in the region. The Pentagon described the action as “measured and defensive,” aiming to degrade Iran’s ability to retaliate without triggering a wider conflict.
Global markets reacted with caution. Oil prices rose again amid renewed concerns about supply disruptions, while risk assets paused their rebound due to rising geopolitical tensions. Treasury yields declined modestly as investors shifted toward safety, although the move was less severe than following the initial Israeli strike. The Federal Reserve has yet to weigh in on how these developments might influence its rate policy, but ongoing conflict introduces a new inflationary wildcard through higher energy prices. Investors appear cautiously optimistic that the escalation can be contained.
Big Beautiful Bill
On July 4th, President Trump signed the One Big Beautiful Bill into law. This legislation introduces sweeping tax changes with far-reaching implications for financial planning. While the bill spans a wide range of policy areas, its tax provisions alone warrant a fresh review of client strategies. The most significant part of the bill made the 2017 tax cuts permanent. It also makes a $6,000 deduction available for seniors, while Social Security income remains taxable.
One of the most significant updates for high-net-worth families is the increase in the federal estate tax exemption to $15 million per individual starting in 2026, with future adjustments for inflation. This higher threshold expands the window for tax-free transfers of wealth to heirs, trusts, or charitable vehicles. For married couples, this could allow up to $30 million to pass estate tax-free, creating a powerful planning opportunity for legacy strategies. At the same time, the bill enhances near-term income planning by raising the standard deduction, increasing the state and local taxes (SALT) cap from $10,000 to $40,000 through 2029 for specific income brackets. The bill also preserved the tax-exempt status of municipal bonds. The magnitude of these shifts presents an important opportunity for investors to reassess their asset allocation, income distribution strategies, and long-term gifting plans to ensure they still align with their current objectives
Looking Forward
With major equity indices regaining ground and volatility easing, global markets appear to be stabilizing after a choppy stretch. However, risks remain, and investor attention has turned to three critical questions:
» Will ongoing tariff negotiations provide lasting resolutions or reignite tensions?
» Can inflation remain contained without stalling economic growth?
» Will escalating geopolitical conflicts stay contained or threaten global economic momentum?
The answers to these questions will likely shape the direction of markets in the months ahead. History reminds us that sharp corrections often create longer-term opportunities. At Meeder, we remain focused on the data, trends, and investor behavior driving markets. Our weight-of-the-evidence process helps us remove emotion and navigate with discipline through volatile environments.
How Is This Impacting Portfolios?
Meeder manages investment strategies that utilize a multidisciplinary and multifactor investment approach, guiding us in allocating our portfolios. We manage investment solutions across an array of risk profiles and time horizons. Many of these solutions employ one or more of our core investment strategies: Growth, Defensive Equity, and Fixed Income.
GROWTH STRATEGY
Investment portfolios employing the Meeder Growth Strategy maintain a more aggressive objective and typically remain invested in the stock market. The Meeder Growth Strategy is designed to capitalize on long-term opportunities in global equity markets, and navigated a turbulent but ultimately rewarding second quarter.
Throughout this volatile period, the Growth Strategy remained fully invested, consistent with its objective of seeking capital appreciation over full market cycles. While this positioning exposed the portfolio to significant near-term volatility during the early April selloff, it also allowed the strategy to fully participate in the subsequent rally following the tariff pause. Performance was driven by strong contributions from U.S. large-cap and technology-oriented sectors, which regained leadership as momentum and investor sentiment improved into June.
From a global perspective, the Growth Strategy maintained meaningful allocations to developed international and emerging market equities. These exposures were supported by continued U.S. dollar weakness and improving economic data in key international regions. While global equity markets lagged U.S. large caps during the rebound, their diversification benefits remained a critical component of the strategy’s broader positioning.
Although the macroeconomic backdrop remains uncertain, with elevated valuations, evolving Fed policy expectations, and geopolitical risks, we believe that market dislocations can create opportunities for investors who remain fully committed to a disciplined, long-term approach. The Growth Strategy’s diversified, fully invested posture positions it to capture upside potential in periods of recovery and expansion while weathering short-term uncertainty through broad market exposure.
DEFENSIVE EQUITY STRATEGY
Portfolios utilizing the Meeder Defensive Equity Strategy employ a quantitative, rules-based, and data-driven approach, utilizing the Meeder Investment Positioning System (IPS) model. This investment model analyzes risk in relation to the reward available in the marketplace and identifies when to adjust the portfolio’s target exposure.
We began the quarter with an equity exposure of 89%. A U.S. trade policy shift surprised markets with the introduction of sweeping new tariffs, triggering a brief but severe selloff. From April 2 to 4, the S&P 500 declined by over 10%, marking one of the most significant short-term drops since 1952.
On April 11, both the VIX and MOVE indexes spiked above their long-term averages, turning the RISK model negative. This model output was a primary driver leading us to reduce equity exposure to 73%. At the same time, investor sentiment indicators (surveys, options activity, and newsletter sentiment) all reflected extreme pessimism, historically associated with market bottoms. This contrarian backdrop, coupled with extreme stock correlation levels, triggered a positive asymmetrical signal in the short-term model.
As April progressed, bearish sentiment persisted, but market breadth and correlation signals strengthened. We increased equity exposure to 77% by April 18 and maintained that level through April 25. The strategy continued to benefit from strong signals in the short-term model driven by rising market breadth, inverse ETF flows, and high stock correlation readings. However, the long-term model score remained negative due to elevated valuations.
Momentum accelerated into May after a nine-day winning streak in the S&P 500, which was the longest since 2004. This significantly improved the short-term model score. Equity exposure increased to 85% on May 2 and then to 90% by May 9 after three key short-term signals all activated simultaneously: extreme breadth, elevated inverse fund flows, and persistently high correlations. Meanwhile, volatility declined meaningfully as the VIX (equity) and MOVE (fixed income) both dropped below their respective long-term averages, improving the RISK score in the investment model to neutral and eventually slightly positive.
By mid-May, the market had rebounded nearly 19% from its April lows. We increased the equity allocation again to 94% and maintained this level through the end of June. The short-term model remained strongly positive, with 8 out of the 10 trend and momentum indicators turning positive. While market risk remained subdued, the intermediate-term model deteriorated modestly as overly bullish sentiment emerged in tech-focused newsletters and options activity—raising contrarian concerns.
Throughout June, equity allocations remained at 94% as the S&P 500 continued to push toward all-time highs. Market volatility remained below historical averages, and trend indicators remained robust. However, our models continued to register mixed intermediate- and long-term signals. The long-term model remained negative due to elevated valuations and lingering inflation risks. The intermediate-term model wavered between neutral and negative, pressured by growing investor optimism in speculative market segments.
The strategy entered a more defensive position early in the quarter but increased its equity exposure steadily as short-term signals improved and market risk receded. Despite long-term headwinds, the weight of the evidence supported a constructive short-term positioning by quarter-end.
FIXED INCOME STRATEGY
The Meeder Fixed Income Strategy tactically shifts portfolio exposure utilizing our proprietary investment models. These models actively monitor economic and market-related factors that guide us in determining the allocations of credit quality, emerging market debt exposure and portfolio duration.
The Meeder Fixed Income Strategy actively navigated a volatile second quarter, marked by rising yields, a shifting Fed outlook, and heightened geopolitical risk. Duration, credit quality, and sector exposure were adjusted consistently in response to these evolving conditions.
We maintained an overweight to high yield throughout the quarter, though with caution, as spreads widened early in April amid the market’s reaction to new U.S. tariffs. In a move to reduce interest rate sensitivity, the portfolio’s duration was shortened from 6.2 years in early May to 4.9 years by mid-month. This adjustment was further validated after the U.S. credit downgrade by Moody’s, which drove yields higher.
Meanwhile, our view on emerging market debt shifted meaningfully. After re-entering the asset class in early May, we maintained an overweight position as the global risk environment improved, and U.S. dollar strength declined. Positive fund flows and stabilizing inflation data supported the position. The allocation to emerging market debt remained in place through quarter-end, contributing to yield enhancement.
In the final week of June, we adjusted our portfolio duration to a more neutral stance, reflecting improved market stability and a more balanced view of interest rate risks. With inflation showing signs of moderation and the Fed maintaining its policy pause, interest rate volatility declined, providing a more favorable backdrop for adding duration exposure.
By quarter-end, the Fixed Income Strategy maintained an overweight position in high-yield and emerging market debt, while holding a neutral duration position. Looking ahead, we remain focused on inflation trends, global monetary policy shifts, and credit spreads as key inputs to our portfolio positioning.
INDEX DEFINITIONS:
S&P 500 Index: The Index tracks the stock performance of 500 of the largest companies listed on stock exchanges in the United States. It is one of the most followed equity indices and includes approximately 80% of the total market capitalization of U.S. public companies.
S&P 500 Equal Weight Index (EWI): The Index is the equal-weight version of the widely-used S&P 500. The index includes the same constituents as the capitalization-weighted S&P 500, but each company in the S&P 500 EWI is allocated a fixed weight—or 0.2% of the index total at each quarterly rebalance.
S&P 400 Index: The Index provides investors with a benchmark for mid-sized companies. The Index is designed to measure the performance of 400 mid-sized companies, reflecting the distinctive risk and return characteristics of this market segment.
Russell 2000 Index: The Index is constructed to provide a comprehensive, unbiased barometer of the small-cap segment of the U.S. equity market. A subset of the Russell 3000 Index, it includes approximately 2,000 of the smallest securities based on a combination of their market cap and current index membership.
Russell 1000 Growth Index: The Index measures the performance of the large-cap growth segment of the US equity universe. It includes those Russell1000 companies with relatively higher price-to-book ratios, higher I/B/E/S forecast medium-term (2 year) growth and higher sales per share historical growth (5 years). The Russell 1000® Growth Index is constructed to provide a comprehensive and unbiased barometer for the large-cap growth segment. The index is reconstituted annually to ensure new and growing equities are included and that the represented companies continue to reflect growth characteristics.
Russell 1000 Value Index: The Index measures the performance of the large-cap value segment of the US equity universe. It includes those Russell 1000 companies with relatively lower price-to-book ratios, lower I/B/E/S forecast medium term (2 year) growth and lower sales per share historical growth (5 years). The Russell 1000® Value Index is constructed to provide a comprehensive and unbiased barometer for the large-cap value segment. The index is completely reconstituted annually to ensure new and growing equities are included and that the represented companies continue to reflect value characteristics
MSCI EAFE Index: The Index is an equity index that captures large and mid-cap representation across 21 Developed Markets countries* worldwide, excluding the U.S. and Canada. With 783 constituents, the index covers approximately 85% of each country’s free float-adjusted market capitalization. MSCI EM Index: The Index captures large and mid-cap representation across 24 Emerging Markets (E.M.) countries. With 1,440 constituents, it covers approximately 85% of each country’s free float-adjusted market capitalization.
MSCI EM Index: The Index captures large and mid-cap representation across 24 Emerging Markets (E.M.) countries. With 1,440 constituents, it covers approximately 85% of each country’s free float-adjusted market capitalization. Russell 2000 Index: The Index is constructed to provide a comprehensive, unbiased barometer of the small-cap segment of the U.S. equity market. A subset of the Russell 3000 Index, it includes approximately 2,000 of the smallest securities based on a combination of their market cap and current index membership.
Bloomberg U.S. Corporate High Yield Bond Index: The Index measures the USD-denominated, high yield, fixed-rate corporate bond market. Securities are classified as high yield if the middle rating of Moody’s, Fitch and S&P is Ba1/BB+/BB+ or below. Bonds from issuers with an emerging markets country of risk, based on the indices’ EM country definition, are excluded. The US Corporate High Yield Index is a component of the US Universal and Global High Yield Indices. The index was created in 1998 with history backfilled to July 1, 1983.
Bloomberg U.S. Aggregate Bond Index: The Index is a broad-based flagship benchmark that measures the investment-grade, U.S. dollar-denominated, fixed-rate taxable bond market. The index includes Treasuries, government-related and corporate securities, fixed-rate agency MBS, ABS, and CMBS (agency and non-agency). Provided the necessary inclusion rules are met, U.S. Aggregate-eligible securities also contribute to the multi-currency Global Aggregate Index and the U.S. Universal Index. The U.S. Aggregate Index was created in 1986, with history backfilled to January 1, 1976.
Commentary offered for informational and educational purposes only. Opinions and forecasts regarding markets, securities, products, portfolios, or holdings are given as of the date provided and are subject to change at any time. No offer to sell, solicit, or recommend any security or investment product is intended. Certain information and data has been supplied by unaffiliated third parties as indicated. Although Meeder believes the information is reliable, it cannot warrant the accuracy, timeliness or suitability of the information or materials offered by third parties.
The views expressed herein are exclusively those of Meeder Investment Management, Inc., are not offered as investment advice, and should not be construed as a recommendation regarding the suitability of any investment product or strategy for an individual’s particular needs. Investment in securities entails risk, including loss of principal. Asset allocation and diversification do not assure a profit or protect against loss. There can be no assurance that any investment strategy will achieve its objectives, generate positive returns, or avoid losses.
Investors cannot invest directly in an index. The performance of any index is not indicative of the performance of any investment and does not take into account the effects of inflation and the fees and expenses associated with investing.
Investment advisory services offered by Meeder Advisory Services, Inc
©2025 Meeder Investment Management, Inc.
0289-MAS-7/14/25-51590