July 2023
Q2 2023 Quarterly Perspectives

By: Aaron Adkins, CFP® ChFC CLU, Investment Communications Strategist

THE FED REMAINS THE CENTER OF ATTENTION
The second quarter headlines revolved around the Fed attempting to control inflation. The Fed raised the target Federal Funds rate at their May meeting by 0.25% to 5.25%. This increase marked the tenth in 14 months, solidifying this as the second fastest-rate tightening cycle since 1974. Inflation results for May and June were lower than analysts’ expectations, with just a 4% and 3% respective increase year-over-year, and investors welcomed the news.

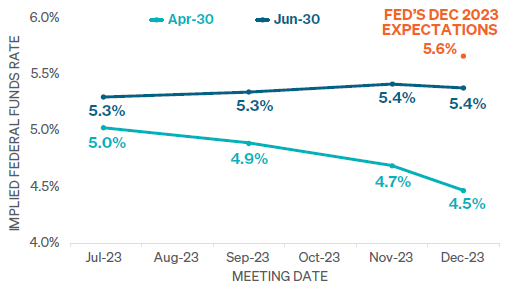
The Federal Reserve held its widely anticipated June meeting, where Chair Jerome Powell discussed the future of interest rates. The committee met investor expectations by announcing a pause in interest rate increases and keeping the target Federal Funds rate at 5.00-5.25%. Conversely, investors were surprised that the committee’s December interest rate expectations shifted noticeably higher from 5.1% to 5.6%, inferring that additional interest rate increases will likely occur later in 2023. After the surprise, investors shifted their rate expectations higher, but according to Bloomberg, the market’s implied Federal Funds rate still remains shy of the Fed’s December forecast. Exhibit 1 illustrates that as of June 30, the Fed expects to raise interest rates before year-end, while the market believes that the Fed will cut rates.

EXHIBIT 1: FED AND MARKET AT ODDS: INTEREST RATE EXPECTATIONS
SOURCE: BLOOMBERG
The Fed’s June Meeting minutes also acknowledged that a recession is probable. “Desk survey respondents still saw a recession occurring in the near term as quite likely….” “Overall, respondents generally continued to expect that any downturn would be neither deep nor prolonged.” So, the Fed expects a recession to occur soon but does not think it will be severe or long in duration.

POWELL AT THE ECB FORUM ON CENTRAL BANKING
In late June, Powell spoke at the ECB Forum on Central Banking, providing even more detail on the FOMC’s thought process around containing inflation. Powell said, “There may be costs associated to restoring price stability. The social costs of failing to restore price stability will be higher. It is something that we have to do. It is one of the principle things that society counts on us to accomplish and I think we all feel committed to accomplishing it.” He finished his thought by saying, “I wouldn’t take moving (interest rates higher) at consecutive meetings off the table at all.” This tone reaffirms that the Fed is willing to accept the risk of pushing the economy into a recession for the increased chance of controlling inflation.

MARKET INDICES MOVE HIGHER THROUGH Q2
The performance of major market indices in 2023 starkly contrasts with those in 2022, as shown in Exhibit 2. Equity markets produced strong returns through June as major stock and bond indices produced positive results. Large-caps stocks, represented by the S&P 500 Index, outpaced the performance of small- and mid-caps.

EXHIBIT 2: MARKET PERFORMANCE UPDATE – JUNE 30, 2023
SOURCE: BLOOMBERG
Despite the Fed’s actions, the Bloomberg U.S. Aggregate Bond Index achieved a positive total return year-to-date. Developed international stocks continue to outperform Emerging Market areas.

NARROW LEADERSHIP
The rally this year looks very strong, but a closer analysis reveals a more concerning picture. The driver of outperformance is primarily due to the large technology weight in market cap-weighted indices like the S&P 500. Exhibit 3 illustrates that just ten stocks are responsible for 77% of the S&P 500 Index’s total return through June 30. This phenomenon is the reason for the calendar year performance disparity between the traditional market cap-weighted S&P 500 Index and the equal-weighted version through June. Since 1991, this year marks the second-highest performance contribution to the S&P 500 Index from the ten most heavily weighted stocks in a calendar year. Only 2007’s contribution of 79% exceeded 2023.

SIGNS OF ECONOMIC STRENGTH
Some recent economic data demonstrates economic strength and supports reasons for additional Fed interest rate hikes before year-end. GDP for the first quarter grew by 1.3%, and the second estimate was revised significantly above the consensus of 1.4% to 2.0%. This revision strongly refutes the notion that the U.S. is on the verge of entering a recession. The labor market remains resiliently strong and seems to be pulling the economy forward.

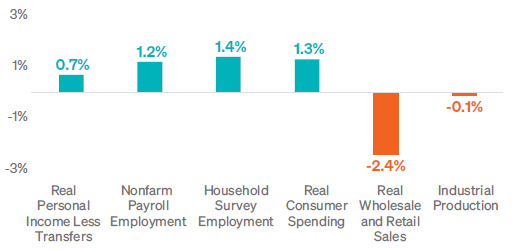
When looking more broadly, the National Bureau of Economic Research reviews six key factors when determining if the economy is in a recession. As of June 30, real wholesale plus retail sales and industrial production were the only two categories that experienced a negative percentage change in the last six months. These additional factors indicate that the economy still maintains substantial strength.

EXHIBIT 3: S&P 500 INDEX PERFORMANCE UPDATE – JUNE 30, 2023: ANNUAL S&P 500 MARKET-CAP INDEX CONTRIBUTION OF 10 LARGEST WEIGHTINGS
SOURCE: STRATEGAS

SIGNS OF ECONOMIC FRAGILITY
Recent data from some notable economic indicators suggest the outlook might not be positive. One of these factors is the U.S. Treasury yield curve. The yield curve remains inverted between the 10- and 2-year Treasury maturities. As of the end of the quarter, the curve reached its steepest inversion since 1981. Investors closely follow this metric because the curve has inverted before each U.S. recession since 1980. Historically, it took an average of 21 months after the initial inversion before a recession occurred.

EXHIBIT 4: THE RECIPE FOR RECESSION – JUNE 30, 2023: PERCENT CHANGE IN LAST 6 MONTHS
SOURCE: J.P. MORGAN ASSET MANAGEMENT
The Leading Economic Index is another widely followed macro indicator that released its May reading at the end of June. The index fell to 106.7, marking the fourteenth consecutive month of decline. Investors use the Leading Index data to help identify economic trends. Historically, the data weakens noticeably before the start of a U.S. recession.

HOW IS THIS IMPACTING PORTFOLIOS?
Meeder manages investment strategies utilizing a multidiscipline and multi-factor approach that guides us in allocating our portfolios. We manage investment solutions across various risk profiles and time horizons. Many of these solutions employ one or more of our core investment strategies: Growth, Defensive Equity, and Fixed Income.

GROWTH STRATEGY
Investment portfolios utilizing the Meeder Growth Strategy maintain a more aggressive objective and typically remain invested in the stock market. The second quarter’s continuation of positive market returns from the first quarter helped drive portfolio performance. Investors in the Meeder Growth Strategy captured much of the upside of the stock market’s robust performance despite continual headlines from Federal Reserve. Investors that remained invested in portfolios employing the Growth Strategy in the second quarter achieved the highest returns of our risk-based portfolios.

DEFENSIVE EQUITY STRATEGY
Portfolios that utilize the Meeder Defensive Equity Strategy follow a quantitative rules-based and data-driven approach using the Meeder Investment Positioning System (IPS) model. This investment model determines the risk relative to the reward present in the marketplace and identifies when we should increase or decrease the portfolio’s target equity exposure.

The IPS model indicated an equity target exposure of 53% to begin the second quarter. Positive  equity market gains were substantial during the quarter and strengthened short- and long-term trend  and momentum factors turning the short- term model score positive. This improvement caused us to  increase the portfolio’s equity exposure to as high as 70% by the middle of April. The IPS model score strengthened as risk in the equity market dropped below 17, but contrarian indicators such as newsletter sentiment became more bullish and negated most of  this improvement. We ended April with our equity exposure at 72%.

In early May, CPI for April came in slightly lower and initial jobless claims were higher than projected. Investor expectations increased around the possibility that a Fed rate cut could come sooner than expected. This pessimistic sentiment, which we view from a contrarian perspective, led to improvements in an already robust intermediate-term model score. Therefore, we increased our equity exposure to 80% toward the end of May.

By mid-June, the long-term model score improved to levels not seen in two years. This improvement was from continued strength in leading macroeconomic indicators and global equity trends. Additionally, all ten momentum indicators in the short-term model turned positive. The combination of these factors led us to increase our equity allocation to 90%, which remained through the end of the second quarter.

FIXED INCOME STRATEGY
The Meeder Fixed Income Strategy tactically shifts portfolio exposure utilizing our proprietary investment models. These models actively monitor economic and marketrelated factors to guide us in determining the credit quality, emerging market debt exposure, and the portfolio’s U.S. Treasury duration.

Short-duration and low credit quality was the name of the game in Q2. U.S. investment-grade bonds produced negative returns, as rates increased during the second quarter. For example, the U.S. 10-year Treasury yield moved from 3.3% to 3.8%. This rate increase allowed the short-duration position within our fixed income strategy to shine, while our exposure to emerging markets and high yield during the quarter was additive relative to holding U.S. investment-grade bonds.

The duration of the fixed income strategy has increased in 2023 but remains shorter than its respective benchmark throughout the second quarter. Our credit quality models were both risk-on at the beginning of the quarter, leading to exposure in both high-yield and emerging markets fixed-income sectors. The bond market experienced some whipsaw during the quarter, which led to a slight decrease in both emerging markets and high-yield exposure during the month of May. Both models ultimately reversed course in early June and the tactical fixed income strategy ended the quarter with an overweight to both areas of higher credit risk.

Commentary offered for informational and educational purposes only. Opinions and forecasts regarding markets, securities, products, portfolios or holdings are given as of the date provided and are subject to change at any time. No offer to sell, solicitation, or recommendation of any security or investment product is intended. Certain information and data has been supplied by unaffiliated third-parties as indicated. Although Meeder believes the information is reliable, it cannot warrant the accuracy, timeliness or suitability of the information or materials offered by third-parties. Advisory services provided by Meeder Asset Management, Inc. and/or Meeder Advisory Services, Inc. Meeder Funds are distributed by Meeder Distribution Services, Inc., member FINRA.

©2023 Meeder Investment Management, Inc.

0107-MIM-7/14/23-35633