You are now leaving Meeder Investment Management. Links to other websites are provided for your convenience and information only. When you click on a link to another website you will be leaving this website. The fact that Meeder Investment Management provides links to other websites does not mean that we endorse, authorize or sponsor the linked website, or that we are affiliated with that website’s owners or sponsors. This material is being provided for informational purposes only and is not a solicitation or an offer to buy any security or to participate in any planning or investment strategy. Unless otherwise indicated, the linked sites are not under our control and we are not responsible for and assume no liability for the content or presentation of any linked site or any link contained in a linked site, or any changes or updates to such sites. We make no representations about the accuracy or completeness of the information contained in any linked sites and their privacy and security policies may differ from ours. We recommend that you review this third-party’s policies and terms carefully.
May 2025: Capital Markets Commentary

Trade Tariffs
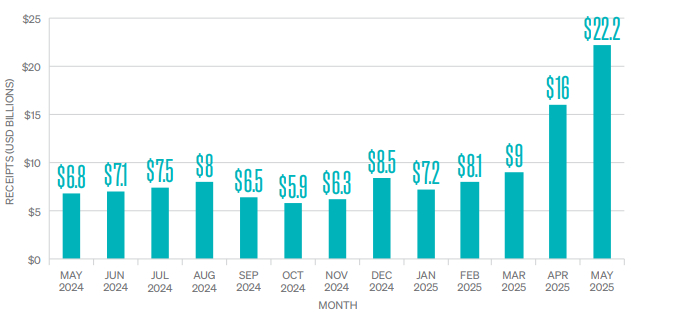
The U.S. Treasury showed that tariff receipts reached more than $22 billion in May, more than tripling the $7.1 billion from just one year ago. Trade negotiations between the U.S. and multiple trade partner countries are at varying stages. Trade talks between the U.S. and China are ongoing, with both sides meeting in mid-May, and they have temporarily agreed to reduce their respective tariffs for 90 days. The U.S. reduced tariffs on Chinese imported goods from 145% to 30%, and China reduced imports from the U.S. from 125% to 10%. Although this is not a permanent resolution, both sides seem to be moving closer to a sustainable agreement.
Tariffs on the European Union of 50% were initially slated to take effect on June 1, 2025. President Trump delayed this implementation until July 9 as an effort for the two sides to negotiate a deal.
MONTHLY CUSTOMS DUTIES RECEIPTS
May 2024–May 2025
Markets
Stocks rallied strongly on the news of trade tensions being eased. The S&P 500 Index climbed more than 6% in May, as investors rallied behind growth-oriented technology companies, propelling the artificial intelligence surge. Mid-cap and small-cap stocks, represented by the S&P 400 and Russell 2000 Index, each gained more than 5%. Smaller company stocks rallied in response to new regulatory reform legislation that is being proposed in Congress to support smaller businesses.
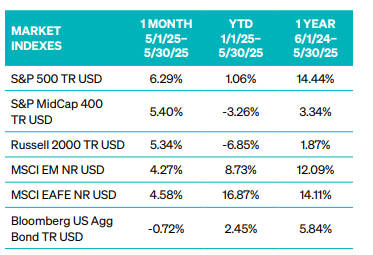
Risks around escalating trade tariffs have weakened the strength of the U.S. Dollar. This decline propelled investor demand for developed international equities in the MSCI EAFE to climb over 16% year-to-date, as the weakening makes the prices more attractive to buyers with other currencies.
Bond markets experienced an increase in volatility as tariff threats risk offsetting recent progress on moderating inflation data. Bond prices ended the month slightly lower after U.S. debt suffered another credit downgrade, but still remain positive over 2% year-to-date.
Moody’s Downgrades U.S. Debt
Moody’s downgraded U.S. sovereign debt from “Aaa” to “Aa1” on May 16, making it the third of the “Big Three” rating agencies to strip the U.S. of its top rating, joining S&P (2011) and Fitch (2023). This could make borrowing costs for the U.S. government higher. In practical terms, this could translate to upward pressure on mortgage, auto-loan, and other consumer rates, as Treasury yields rise to reflect the perceived increase in credit risk. The downgrade is noteworthy but not disastrous and is a timely reminder that disciplined planning, regular reviews, and a long-term perspective remain the best defense against market fluctuations.
Corporate Earnings
The earnings season for the first quarter is now complete according to FactSet, and companies in the S&P 500 delivered quarterly gains of 13.3% year over year, exceeding analyst expectations of 9%. The Technology and Utilities sectors grew significantly year-over-year, with gains of 12.5% and 10.7%, respectively. Energy was the worst performing sector, falling by -14.2% as oil prices dropped by -7% in the first quarter.
Inflation and the Fed
The Federal Reserve held its May meeting and kept interest rates steady at a range of 4.25% to 4.50%, as investors expected. Powell reiterated that the Fed is not influenced by political statements and considers “only the data, the outlook, and the balance of risks.” The Fed’s next meeting to decide the future of interest rates is June 18, and according to CME FedWatch, there is a 97% chance the committee will keep rates at their current level and continue to monitor economic data releases.
The second estimate showed that U.S. GDP contracted by an annualized rate of -0.2% in the first quarter of 2025, instead of the first estimate of -0.3%, marking its first decline in 3 years. Deeper analysis reveals that weaker consumer spending and a larger trade deficit drove the decline as businesses tried to front-run imports before tariffs took effect. When net exports, inventories, and government spending were removed, GDP still grew by 3%. That resilience carried over into the labor markets, where May’s U.S. nonfarm payrolls rose by 139,000 and exceeded analyst expectations of 130,000. Unemployment remained steady at 4.2%. This data shows that despite the headline slowdown in GDP, the U.S. economy remains backed by a strong labor market.
At the end of May, April’s PCE inflation price index data indicated a rise of just 2.1%, which was below consensus forecasts of 2.3%. This softer-than-expected reading suggests that inflationary pressures may be cooling more rapidly than economists had anticipated, and investors welcomed the news.
Commentary offered for informational and educational purposes only. Opinions and forecasts regarding markets, securities, products, portfolios, or holdings are given as of the date provided and are subject to change at any time. No offer to sell, solicit, or recommend any security or investment product is intended. Certain information and data has been supplied by unaffiliated third parties as indicated. Although Meeder believes the information is reliable, it cannot warrant the accuracy, timeliness or suitability of the information or materials offered by third parties.
Investors cannot invest directly in an index. The performance of any index is not indicative of the performance of any investment and does not take into account the effects of inflation and the fees and expenses associated with investing.
INDEX DESCRIPTIONS
S&P 500 Index: The Index tracks the stock performance of 500 of the largest companies listed on stock exchanges in the United States. It is one of the most followed equity indices and includes approximately 80% of the total market capitalization of U.S. public companies.
S&P 400 Index: The S&P MidCap 400® provides investors with a benchmark for mid-sized companies. The index, which is distinct from the large-cap S&P 500®, is designed to measure the performance of 400 mid-sized companies, reflecting the distinctive risk and return characteristics of this market segment.
Russell 2000 Index: The Index is constructed to provide a comprehensive, unbiased barometer of the small-cap segment of the U.S. equity market. A subset of the Russell 3000 Index, it includes approximately 2,000 of the smallest securities based on a combination of their market cap and current index membership.
MSCI EM Index: The Index captures large and mid-cap representation across 24 Emerging Markets (E.M.) countries. With 1,440 constituents, it covers approximately 85% of each country’s free float-adjusted market capitalization.
MSCI EAFE Index: The Index is an equity index that captures large and mid-cap representation across 21 Developed Markets countries*worldwide, excluding the U.S. and Canada. With 783 constituents, the index covers approximately 85% of each country’s free float-adjusted market capitalization. MSCI EM Index: The Index captures large and mid-cap representation across 24 Emerging Markets (E.M.) countries. With 1,440 constituents, it covers approximately 85% of each country’s free float-adjusted market capitalization.
Bloomberg U.S. Aggregate Bond Index: The Index is a broad-based flagship benchmark that measures the investment-grade, U.S. dollar-denominated, fixed-rate taxable bond market. The index includes Treasuries, government-related and corporate securities, fixed-rate agency MBS, ABS, and CMBS (agency and non-agency). Provided the necessary inclusion rules are met, U.S. Aggregate-eligible securities also contribute to the multi-currency Global Aggregate Index and the U.S. Universal Index. The U.S. Aggregate Index was created in 1986, with history backfilled to January 1, 1976.
Investment advisory services offered by Meeder Advisory Services, Inc
©2025 Meeder Investment Management, Inc.
0289-MAS-6/16/25-51300