You are now leaving Meeder Investment Management. Links to other websites are provided for your convenience and information only. When you click on a link to another website you will be leaving this website. The fact that Meeder Investment Management provides links to other websites does not mean that we endorse, authorize or sponsor the linked website, or that we are affiliated with that website’s owners or sponsors. This material is being provided for informational purposes only and is not a solicitation or an offer to buy any security or to participate in any planning or investment strategy. Unless otherwise indicated, the linked sites are not under our control and we are not responsible for and assume no liability for the content or presentation of any linked site or any link contained in a linked site, or any changes or updates to such sites. We make no representations about the accuracy or completeness of the information contained in any linked sites and their privacy and security policies may differ from ours. We recommend that you review this third-party’s policies and terms carefully.
» Consumer Sentiment Declines
» Labor Markets Remain Solid
» The Fed Pauses
» January Barometer
» China Disrupts Competition in A.I. Race

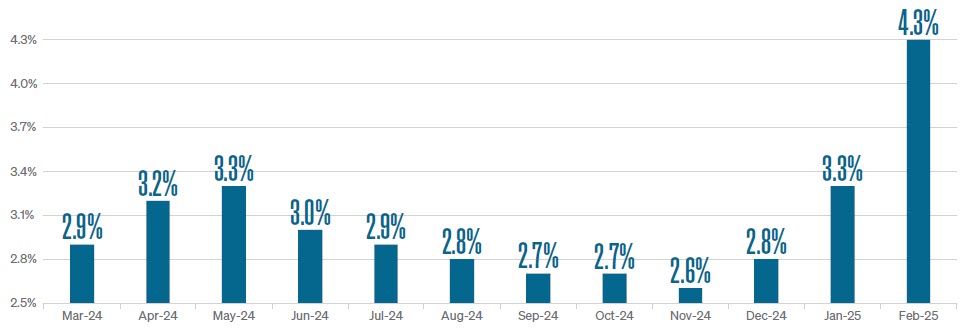
Although the Fed is making significant progress in curbing inflation, it remains higher than they would like. For example, January’s PCE inflation increased 0.30% month-over-month for a year-over-year increase of 2.6%. This result was in line with analyst estimates but is the highest level for PCE since May of 2024 and is the fourth consecutive monthly increase.
But what if January’s performance is negative? If so, the odds drop to a 54.5% chance of gains, with an average return of 3.1% for the rest of the year. While history does not always predict the future, January’s trends can help shape expectations.
Commentary offered for informational and educational purposes only. Opinions and forecasts regarding markets, securities, products, portfolios, or holdings are given as of the date provided and are subject to change at any time. No offer to sell, solicit, or recommend any security or investment product is intended. Certain information and data has been supplied by unaffiliated third parties as indicated. Although Meeder believes the information is reliable, it cannot warrant the accuracy, timeliness or suitability of the information or materials offered by third parties.
Investors cannot invest directly in an index. The performance of any index is not indicative of the performance of any investment and does not take into account the effects of inflation and the fees and expenses associated with investing.
Investment advisory services offered by Meeder Advisory Services, Inc.
INDEX DESCRIPTIONS
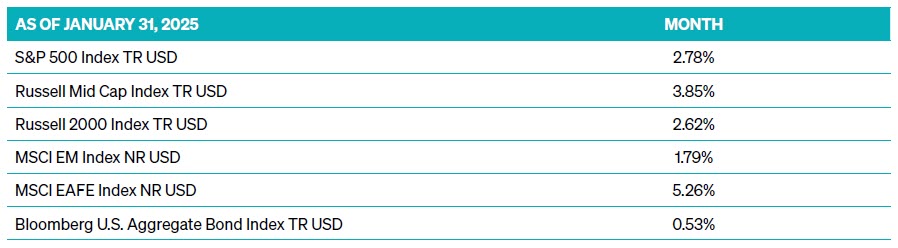
S&P 500 Index: The Index tracks the stock performance of 500 of the largest companies listed on stock exchanges in the United States. It is one of the most followed equity indices and includes approximately 80% of the total market capitalization of U.S. public companies.
The Russell Midcap® Index: The index is a subset of the Russell 1000® Index. It includes approximately 800 of the smallest securities based on a combination of their market cap and current index membership. The Russell Midcap® Index represents approximately 27% of the total market capitalization of the Russell 1000® companies, as of the most recent reconstitution. The Russell Midcap Index is constructed to provide a comprehensive and unbiased barometer for the mid-cap segment. The index is completely reconstituted annually.
Russell 2000 Index: The Index is constructed to provide a comprehensive, unbiased barometer of the small-cap segment of the U.S. equity market. A subset of the Russell 3000 Index, it includes approximately 2,000 of the smallest securities based on a combination of their market cap and current index membership.
MSCI EM Index: The Index captures large and mid-cap representation across 24 Emerging Markets (E.M.) countries. With 1,440 constituents, it covers approximately 85% of each country’s free float-adjusted market capitalization.
MSCI EAFE Index: The Index is an equity index that captures large and mid-cap representation across 21 Developed Markets countries* worldwide, excluding the U.S. and Canada. With 783 constituents, the index covers approximately 85% of each country’s free float-adjusted market capitalization. MSCI EM Index: The Index captures large and mid-cap representation across 24 Emerging Markets (E.M.) countries. With 1,440 constituents, it covers approximately 85% of each country’s free float-adjusted market capitalization.
Bloomberg U.S. Aggregate Bond Index: The Index is a broad-based flagship benchmark that measures the investment-grade, U.S. dollar-denominated, fixed-rate taxable bond market. The index includes Treasuries, government-related and corporate securities, fixed-rate agency MBS, ABS, and CMBS (agency and non-agency). Provided the necessary inclusion rules are met, U.S. Aggregate-eligible securities also contribute to the multi-currency Global Aggregate Index and the U.S. Universal Index. The U.S. Aggregate Index was created in 1986, with history backfilled to January 1, 1976.
©2025 Meeder Investment Management, Inc.
0289-MAS-2/14/25-48667