You are now leaving Meeder Investment Management. Links to other websites are provided for your convenience and information only. When you click on a link to another website you will be leaving this website. The fact that Meeder Investment Management provides links to other websites does not mean that we endorse, authorize or sponsor the linked website, or that we are affiliated with that website’s owners or sponsors. This material is being provided for informational purposes only and is not a solicitation or an offer to buy any security or to participate in any planning or investment strategy. Unless otherwise indicated, the linked sites are not under our control and we are not responsible for and assume no liability for the content or presentation of any linked site or any link contained in a linked site, or any changes or updates to such sites. We make no representations about the accuracy or completeness of the information contained in any linked sites and their privacy and security policies may differ from ours. We recommend that you review this third-party’s policies and terms carefully.

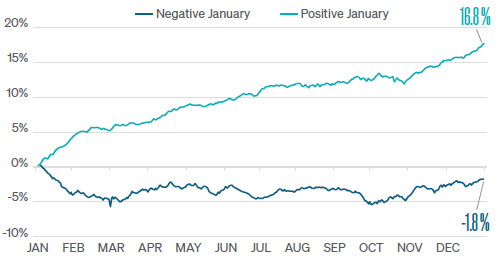
Believers of the indicator argue that it reflects investor sentiment and can set the tone for the rest of the year. They believe that strong performance in January indicates confidence and optimism among investors, leading to continued buying and rising prices. Conversely, weak performance in January suggests pessimism and caution, leading to selling and declining prices.
And they have statistics to back them up. Going back to 1950, a positive January has led to average returns in the S&P 500 of 16.8% while a negative January has led to average returns of -1.8% for the corresponding year (see Figure 1). So, with the S&P 500 up 1.7% this past January, should we load up on equities? Not quite.
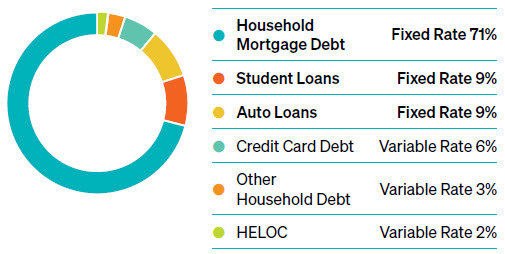
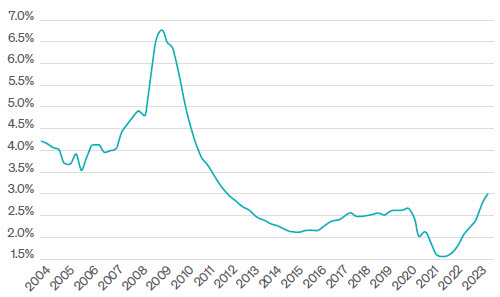
89% of U.S. consumer debt, primarily composed of mortgages, student loans, and auto loans, is fixed thus shielding it from impact (see Figure 2). A much smaller percentage of debt, primarily in floating credit card rates, is tasked with doing the Fed’s bidding. In the aggregate, it has not affected the consumer at large but rather smaller pockets of low-income households carrying credit card debt. These households are bearing the brunt of the pain as credit card delinquencies are on the rise and above pre-pandemic levels (see Figure 3). A continuance of this trend could spell trouble.
Commentary offered for informational and educational purposes only. Opinions and forecasts regarding markets, securities, products, portfolios, or holdings are given as of the date provided and are subject to change at any time. No offer to sell, solicitation, or recommendation of any security or investment product is intended. Certain information and data has been supplied by unaffiliated third parties as indicated. Although Meeder believes the information is reliable, it cannot warrant the accuracy, timeliness or suitability of the information or materials offered by third parties.
Investment advisory services provided by Meeder Asset Management, Inc.
INDEX DESCRIPTIONS
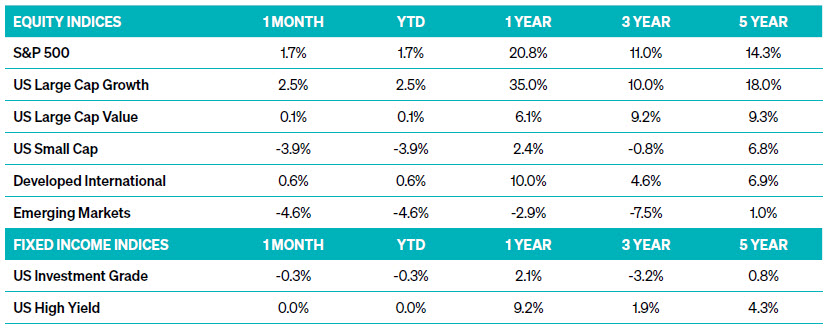
S&P 500 Index – The Index tracks the stock performance of 500 of the largest companies listed on stock exchanges in the United States. It is one of the most followed equity indices and includes approximately 80% of the total market capitalization of U.S. public companies.
Russell 1000 Growth Index – The Index measures the performance of the large-cap growth segment of the US equity universe. It includes those Russell 1000 companies with relatively higher price-to-book ratios, higher I/B/E/S forecast medium-term (2-year) growth, and higher sales per share historical growth. The Index is constructed to provide a comprehensive and unbiased barometer for the large-cap growth segment. The index is completely reconstituted annually to ensure new and growing equities are included and that the represented companies continue to reflect growth characteristics.
Russell 1000 Value Index – The Index measures the performance of the large-cap value segment of the US equity universe. It includes those Russell 1000 companies with relatively lower price-to-book ratios, lower I/B/E/S forecast medium-term (2 years) growth, and lower sales per share historical growth (5 years). The Index is constructed to provide a comprehensive and unbiased barometer for the large-cap value segment. The index is completely reconstituted annually to ensure new and growing equities are included and that the represented companies continue to reflect value characteristics.
Russell 2000 Index – The Index is constructed to provide a comprehensive, unbiased barometer of the small-cap segment of the US equity market. A subset of the Russell 3000 Index, it includes approximately 2,000 of the smallest securities based on a combination of their market cap and current index membership.
MSCI EAFE Index – The Index is an equity index that captures large and mid-cap representation across 21 Developed Markets countries* around the world, excluding the US and Canada. With 783 constituents, the index covers approximately 85% of the free float-adjusted market capitalization in each country.
MSCI EM Index – The Index captures large and mid-cap representation across 24 Emerging Markets (EM) countries*. With 1,440 constituents, the index covers approximately 85% of the free float-adjusted market capitalization in each country.
Bloomberg US Aggregate Bond Index – The Index is a broad-based flagship benchmark that measures the investment grade, US dollardenominated, fixed-rate taxable bond market. The index includes Treasuries, government-related and corporate securities, fixed-rate agency MBS, ABS, and CMBS (agency and non-agency). Provided the necessary inclusion rules are met, US Aggregate-eligible securities also contribute to the multi-currency Global Aggregate Index and the US Universal Index. The US Aggregate Index was created in 1986, with history backfilled to January 1, 1976.
ICE BofA US High Yield Bond Index – The Index tracks the performance of US dollar denominated below investment grade rated corporate debt publicly issued in the US domestic market. To qualify for inclusion in the index, securities must have a below investment grade rating (based on an average of Moody’s, S&P, and Fitch) and an investment grade rated country of risk (based on an average of Moody’s, S&P, and Fitch foreign currency long term sovereign debt ratings). Each security must have greater than 1 year of remaining maturity, a fixed coupon schedule, and a minimum amount outstanding of $100 million. Original issue zero coupon bonds, “global” securities (debt issued simultaneously in the Eurobond and US domestic bond markets), 144a securities, and pay-in-kind securities, including toggle notes, qualify for inclusion in the Index. Callable perpetual securities qualify, provided they are at least one year from the first call date. Fixed-to-floating rate securities also qualify, provided they are callable within the fixed rate period and are at least one year from the last call prior to the date the bond transitions from a fixed to a floating rate security. DRD-eligible and defaulted securities are excluded from the Index.
©2024 Meeder Investment Management, Inc.
0116-MAM-2/23/24-40628