You are now leaving Meeder Investment Management. Links to other websites are provided for your convenience and information only. When you click on a link to another website you will be leaving this website. The fact that Meeder Investment Management provides links to other websites does not mean that we endorse, authorize or sponsor the linked website, or that we are affiliated with that website’s owners or sponsors. This material is being provided for informational purposes only and is not a solicitation or an offer to buy any security or to participate in any planning or investment strategy. Unless otherwise indicated, the linked sites are not under our control and we are not responsible for and assume no liability for the content or presentation of any linked site or any link contained in a linked site, or any changes or updates to such sites. We make no representations about the accuracy or completeness of the information contained in any linked sites and their privacy and security policies may differ from ours. We recommend that you review this third-party’s policies and terms carefully.
International Equity Markets: A Structural Regime Change and Its Portfolio Implications

» International equities have posted one of their strongest outperformance periods vs. the U.S. in years—sparked by the 2025 reciprocal tariff shock, and reinforced by dollar weakness and low starting ownership levels. That shock has since evolved into something more durable: a broadening AI supply chain beyond U.S. borders, European fiscal/defense expansion, and governance reform in Japan and Korea—now confirmed by a strong improvement in Developed International (EAFE) and Emerging Markets (EM) earnings revisions.
» Not all international exposure is the same. Developed International reflects durable structural change and remains more differentiated from U.S. markets than Emerging Markets. U.S. equities capture the AI theme’s demand and application layers (hyperscalers, model developers, software), but the capital-intensive compute layer sits largely in Taiwan, South Korea, and the Netherlands—where EM offers the clearest access, with different political and geographic risks attached.
» We believe a meaningful, dynamically-sized allocation to international equities is a key part of long-term strategy. EAFE offers the more durable diversification benefit against U.S. concentration risk; EM’s role is better understood as exposure to the same AI theme through different geography. Both are additive, for different reasons.
» Meeder’s tactical mutual funds provide exposure to U.S., Developed International, and Emerging Markets equities, using our systematic process to dynamically allocate between these regions over time. Since mid2025, our quantitative research process has led to a consistent tilt toward Non-U.S. equities across our Tactical Funds.
A Decade of U.S. Dominance
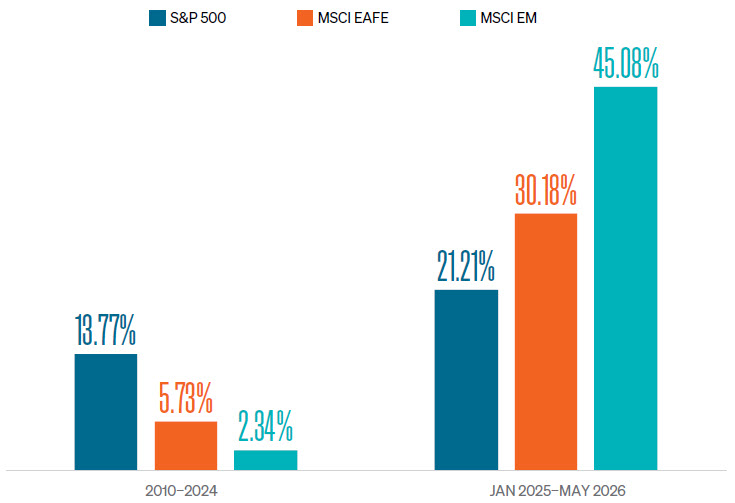
Between 2010 and 2024, the U.S. equity markets outperformed international markets, with the S&P 500 Index compounding at 13.8% annually versus 5.7% for the MSCI EAFE (Europe, Australasia, and Far East) Index and 2.3% for the MSCI EM (Emerging Markets) Index. The performance gap was not accidental; it can largely be attributed to four mutually reinforcing structural advantages that sustained U.S. equity outperformance throughout the period.
EXHIBIT 1:
ANNUALIZED TOTAL RETURNS
S&P 500, MSCI EAFE, MSCI EM (2010–2025)
SOURCE: BLOOMBERG AS OF JUL-26. THE PERFORMANCE DATA SHOWN REPRESENTS PAST PERFORMANCE, WHICH DOES NOT GUARANTEE FUTURE RESULTS.
The Structural Underpinnings of U.S. Dominance
TECHNOLOGY SECTOR
CONCENTRATION
The rise of mega-cap technology drove a significant share of U.S. equity returns during the period. No equivalent concentration of high-growth secular compounders existed in the MSCI EAFE or EM indices, which remained more heavily weighted toward financials, industrials, energy, and materials.
EARNINGS GROWTH
DIFFERENTIAL
In the period following the global financial crisis through 2024, U.S. earnings grew
7.1% faster than EAFE earnings and 8.3% faster than EM earnings on an annualized basis.[1] This was not a valuation story. It was a genuine fundamental advantage rooted in corporate dynamism, lighter regulation, deeper capital markets, and the technology-driven productivity boom.
U.S. DOLLAR
STRENGTH
The dollar appreciated materially through much of this period, mechanically suppressing the USD-denominated returns of foreign equity investments. From 2010 to 2024, a 7.5% annual local-currency gain in the MSCI EAFE Index was reduced to 5.9% after adverse currency conversion, a headwind that compounded over 15 years into a cumulative 21% drag on non-U.S. returns.[1]
CAPITAL FLOW
REINFORCEMENT
More than three-fourths of global equity fund flows over the 2010–2024 period
were directed into U.S. assets, even though, as of 2025, the U.S. represents 65% of
the MSCI ACWI index and less than 50% of global earnings.[2] This concentration
became largely self-reinforcing: inflows drove prices higher, higher prices validated
the decision to allocate to the U.S., and higher allocations attracted further inflows,
a cycle that compounded over 15 years.
The decade from 2010 to 2024 was not simply a period of U.S. outperformance. It was a self-reinforcing cycle in which technology-driven earnings growth, dollar appreciation, and concentrated capital flows created a structural premium that proved remarkably durable.
In 2025-2026, U.S. equity market dominance was interrupted as international equities outperformed domestic stocks by one of the widest margins in years. This reversal, catalyzed by the announcement of sweeping reciprocal tariffs by the U.S., has prompted investors to question whether this shift represents a cyclical correction or a structural regime change.
The Anatomy of a Regime Shift
The 2025-2026 international outperformance reflected the convergence of a policy shock that disrupted the existing order, structural reforms years in the making that markets had systematically underpriced, and mechanical amplifiers that translated modest fundamental improvements into outsized equity returns.
The Trigger: Tariff Shock
The proximate catalyst for the 2025 rotation was the announcement of sweeping reciprocal tariffs by the United States, which produced a simultaneous selloff in U.S. equities, the U.S. dollar, and U.S. Treasury bonds. Unlike prior periods of equity stress, the U.S. dollar and U.S. Treasuries fell alongside equities, challenging the historical safe-haven pattern of bonds and inviting a reassessment of the United States’ role as the default anchor of global portfolios[JB6.1][SS6.2]. More noticeably, U.S. Treasury yields rose even as the dollar weakened, a combination historically associated with fiscal credibility concerns rather than ordinary risk-off behavior.
The tariff shock, with higher tariffs on goods, initially had a negative impact on export-heavy international markets but, more importantly, the announcement catalyzed a fundamental reassessment of U.S. policy predictability, prompting investors globally to question a decade of concentrated U.S. positioning that had previously gone largely unchallenged. This reassessment was reinforced by an unusual simultaneous decline in U.S. equities and the U.S. dollar, breaking the historical pattern in which equity stress typically strengthens the dollar as investors seek U.S. safe-haven assets. For U.S.-based investors, the mechanical effect was immediate: a weakening dollar made international equity returns more attractive in USD terms at precisely the moment sentiment was shifting toward diversification in international equity markets.
The Amplifiers: Dollar Weakness and Repositioning to International Overweight
-11%
USD vs. MSCI EAFE
currencies, 2025
-7%
USD vs. MSCI EM
currencies, 2025
~65%
U.S. share of the
MSCI ACWI Index
The U.S. dollar declined approximately 11% against MSCI EAFE currencies and approximately 7% against MSCI EM currencies in 2025.[1] This decline represented a direct performance tailwind for U.S.-based investors holding international equities, as local currency gains converted back to a weaker dollar.
Dollar weakness in 2025 was at least partly a consequence of the U.S. Tariff regime shift: the Liberation Day shock weakened
confidence in U.S. assets as a safe haven, and the widening U.S. fiscal deficit raised some longer-term concerns about dollar
reserve status. The concurrent rally in gold reinforced this interpretation, with central bank purchases remaining well above
historical averages for a fourth consecutive year by 2025.[3] Whether dollar weakness persists may therefore be closely linked
to whether the broader regime shift is durable, with the two influenced by the same underlying forces.
A decade of concentrated U.S. equity inflows resulted in the U.S. representing roughly 65% of the MSCI ACWI Index.[1] When the Liberation Day trigger arrived, even modest rebalancing toward international markets appeared to generate outsized demand
from a relatively low base of ownership.
The Structural Enablers
The trigger and amplifiers help explain the timing and magnitude of the rotation, but they do not fully explain its breadth or the specific regions and sectors that led it. That requires examining the structural improvements that had been building across developed and emerging international markets and were recognized by investors once the catalyst arrived.
THE AI TRADE BROADENING BEYOND THE U.S.
The Artificial Intelligence (AI) investment cycle that dominated U.S. equity returns in 2023 and 2024 began to broaden out in 2025, generating returns for markets embedded in the global hardware and infrastructure supply chain that enables AI at scale. This broadening was analytically distinct from a simple spillover of U.S. tech enthusiasm. It reflected a meaningful supply-side dependency: the AI ambitions of U.S. hyperscalers -global cloud/data-center companies that operate infrastructure at massive scale- were heavily dependent on semiconductor fabrication capacity in Taiwan, memory production in South Korea and Japan, and lithography equipment from ASML in the Netherlands, with hyperscaler data center spending projected to exceed $700 billion in 2026. The demand signal was U.S.-generated; the supply chain was international.[4]
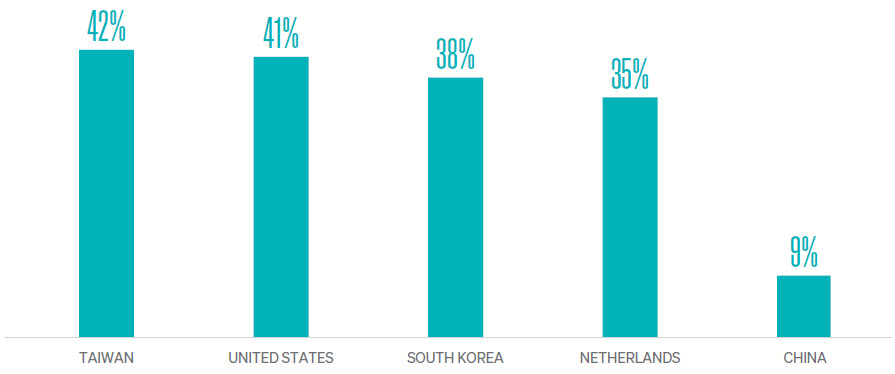
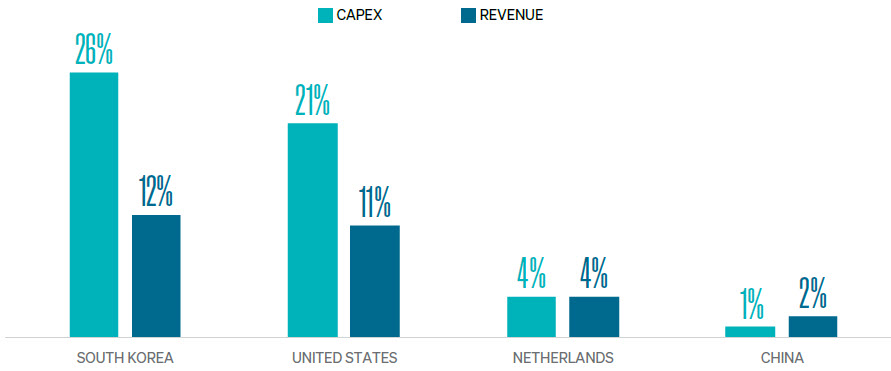
The macroeconomic footprint of global AI giants has grown to a scale that can materially influence equity market returns across multiple jurisdictions. By the end of 2025, the top 20 publicly listed AI firms accounted for 30–40% of total equity market capitalization in the United States, Taiwan, South Korea, and the Netherlands, making each of these markets a significant AI proxy. In South Korea alone, AI-related firms accounted for 26% of total capital expenditure by the end of 2024, a share comparable to the United States and reflecting the degree to which the Korean economy and its equity market are now structurally embedded in the global AI investment cycle.[5]
Exhibit 2:
SHARE OF GLOBAL AI GIANTS IN RESPECTIVE EQUITY MARKET CAPITALIZATION
SOURCE: BIS BULLETIN NO 122, GLOBAL GIANTS IN THE AI SUPPLY CHAIN, FEB 2026 AS OF JUL-26. THE PERFORMANCE DATA SHOWN REPRESENTS PAST PERFORMANCE, WHICH DOES NOT GUARANTEE FUTURE RESULTS.
Exhibit 3:
SHARE OF GLOBAL AI GIANTS IN TOTAL CAPITAL EXPENDITURE BY COUNTRY
SOURCE: BIS BULLETIN NO 122, GLOBAL GIANTS IN THE AI SUPPLY CHAIN, FEB 2026 AS OF JUL-26. THE PERFORMANCE DATA SHOWN REPRESENTS PAST PERFORMANCE, WHICH DOES NOT GUARANTEE FUTURE RESULTS.
The same AI infrastructure buildout that drove semiconductor demand also generated significant commodity demand, specifically for copper, which is used extensively in data center power infrastructure and transmission, and for lithium, which is essential to the energy storage systems supporting AI-driven electricity demand growth. Latin America, as one of the world’s leading producers of both copper and lithium, emerged as a significant beneficiary of this global tech expansion.
Commodities served as a key catalyst for the rally in Latin American equity markets in 2025. Chile, Peru, and Brazil saw equity markets respond positively to both price appreciation in the commodity itself and to the multi-year forward demand visibility implied by announced hyperscaler capital expenditure programs.[6]
ASIA: IMPROVED CORPORATE GOVERNANCE
Japan and South Korea entered 2025 with multi-year corporate governance reform programs that have been steadily reshaping their equity markets. In Japan, The Tokyo Stock Exchange’s sustained pressure on listed companies to improve return on equity, unwind cross-shareholdings, and return capital to shareholders has been building since the Abenomics era but gained further momentum from 2023 onward. As a result, share buyback volumes roughly doubled during this period, reflecting a broader shift in corporate behavior toward shareholder returns.[7] Pro-growth fiscal and monetary policy under Prime Minister Takaichi and Japan’s deep integration into the global AI and semiconductor supply chain reinforced these governance reforms, driving both corporate earnings growth and sustained foreign investor interest in Japanese equities.
South Korea’s Value-Up program was also launched in 2024 and accelerated through 2025 with amendments to the Commercial Act establishing directors’ fiduciary duty toward all shareholders. The program targeted the Korea Discount, the structural undervaluation of Korean equities often attributed to chaebols’ cross-shareholdings and chronic capital misallocation.[8] The Korea Composite Stock Price Index’s (KOSPI) trailing 12-month price-to-earnings (PE) ratio expanded from under 10x in 2022 to over 25x by 2025, suggesting a strong correlation between improving governance and shareholder returns. However, the KOSPI still trades at approximately nine times 12-month forward earnings as of June 2026, suggesting further valuation normalization is possible if governance reforms continue to gain traction.[9] This trailing multiple reflects governance-driven re-rating on historical earnings; on a forward basis, the picture looked markedly different given the scale of earning’s growth.
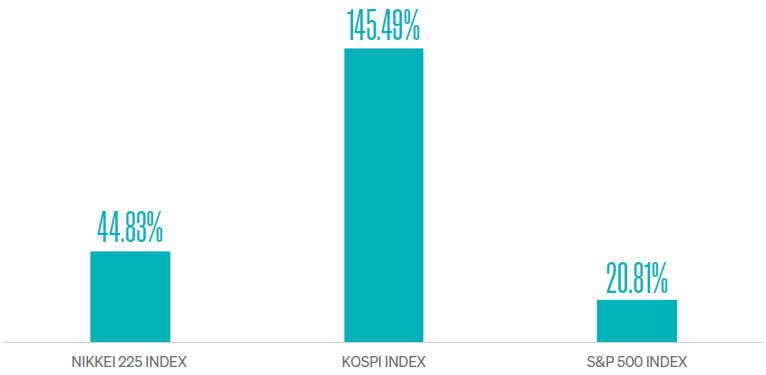
As shown in Exhibit 4, the Nikkei 225 returned 44.83% and the KOSPI Index returned 145.5% in USD terms from January 2025 through May 2026, compared to just 20.8% for the S&P 500, consistent with both the governance reform tailwind and the AI semiconductor earnings cycle operating simultaneously.
Exhibit 4:
CUMULATIVE TOTAL RETURNS OF NIKKEI, KOSPI, AND S&P 500
JANUARY 2025–MAY 2026
SOURCE: BLOOMBERG AS OF JUL-26. THE PERFORMANCE DATA SHOWN REPRESENTS PAST PERFORMANCE, WHICH DOES NOT GUARANTEE FUTURE RESULTS.
EUROPE: FISCAL REGIME CHANGE AND INCREASED DEFENSE SPENDING
One of the most notable structural developments in European markets was Germany’s decision in March 2025 to suspend its constitutional debt brake, the Schuldenbremse, and commit to a €500 billion infrastructure fund alongside defense spending explicitly exempted from constitutional borrowing limits.
The changes extended beyond Germany. The announcement complemented a broader European fiscal expansion, with the EU’s ReArm Europe program mobilizing up to €800 billion for defense capability.[10] Importantly, defense spending was not merely a downstream beneficiary of Germany’s fiscal expansion; it served as a primary justification for it, making the two developments closely intertwined. At the NATO Summit, European allies also committed to raising core defense spending to 3.5% of GDP by 2035, up from the prior 2% target, with an additional 1.5% earmarked for broader security.[11]
All of these actions appear to signal a clear shift in European fiscal philosophy departing from a pattern of fiscal conservatism that many economists argue had constrained European growth for over a decade.[12]
Exhibit 5:
EUROPEAN DEFENSE VS. BROAD EUROPEAN AND U.S. EQUITY RETURNS
JANUARY 2025–MAY 2026
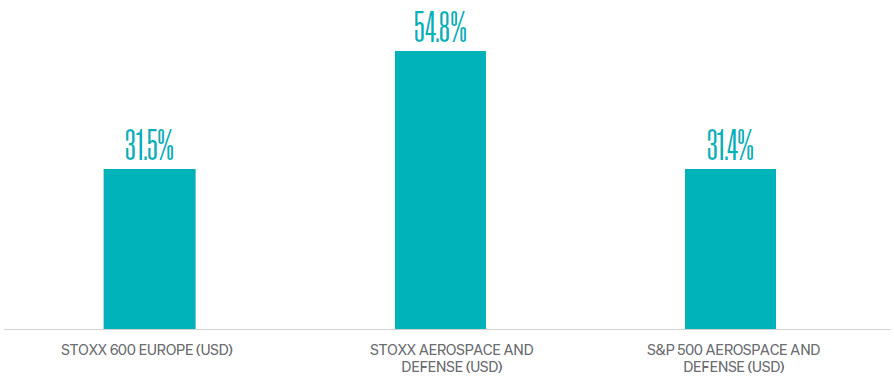
SOURCE: BLOOMBERG AS OF JUL-26. THE PERFORMANCE DATA SHOWN REPRESENTS PAST PERFORMANCE, WHICH DOES NOT GUARANTEE FUTURE RESULTS.
EARNINGS REVISIONS: THE FUNDAMENTAL CONFIRMATION
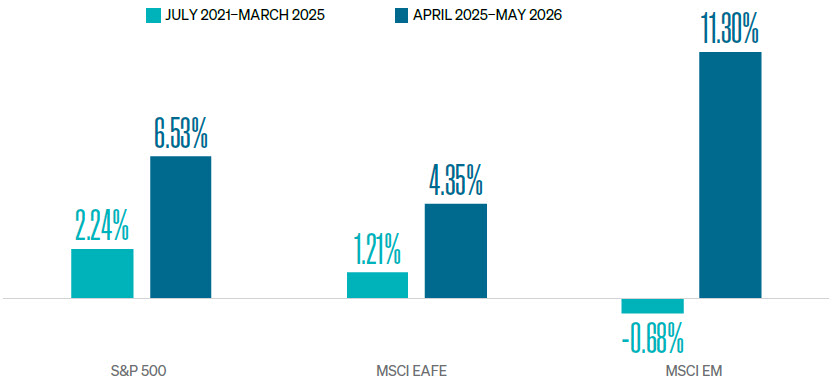
These structural tailwinds have had a meaningful impact on performance, but one of the clearer indications of a shift comes from positive earnings per-share (EPS) estimate revision momentum; the rate at which analyst consensus earnings forecasts are being revised upward. Exhibit 6 compares the average 3-month change in forward one year EPS across MSCI EAFE, MSCI EM, and the S&P 500 during two distinct periods: July 2021 through March 2025, and the post-Liberation Day period from April 2025 through May 2026.
Exhibit 6:
3-MONTH CHANGE IN FORWARD ONE YEAR EPS
SOURCE: BLOOMBERG AS OF JUL-26. THE PERFORMANCE DATA SHOWN REPRESENTS PAST PERFORMANCE, WHICH DOES NOT GUARANTEE FUTURE RESULTS.
The contrast is notable. In the baseline period, the MSCI EM Index revision momentum averaged -0.68%, a persistent pattern of analyst downgrades consistent with historical earnings disappointment. The MSCI EAFE Index averaged +1.21%, and the S&P 500 averaged +2.24%. The prior regime, in short, rewarded U.S. earnings delivery, penalized international earnings disappointment, and allocated capital accordingly.
MSCI EM
11.3%
from -0.68% baseline
MSCI EAFE
4.35%
from 1.21% baseline
S&P 500
6.53%
from 2.24% baseline
The post-Liberation Day period points to a different earnings revision pattern. The MSCI EM Index earnings revision momentum accelerated to 11.3%, a swing of nearly 12 percentage points from the prior baseline, representing a notable shift in the prevailing trend. The MSCI EAFE Index improved to 4.35% from 1.21%, a more measured but equally directional shift. Notably, S&P 500 revision momentum also improved, from 2.24% to 6.53%, suggesting that the post-Liberation Day environment was broadly constructive for global earnings. The investment case for international does not rest on U.S. earnings deteriorating; it rests on international earnings improving more dramatically, from a significantly lower base, at valuations that may not have fully adjusted to reflect that improvement.
ONE IMPORTANT QUALIFICATION ON EMERGING MARKETS
The Emerging Markets revision figure warrants one important qualification. The earnings upgrade cycle appears less broad-based across the region, instead showing concentration in markets directly embedded in the AI hardware supply chain. For example, Goldman Sachs Research forecasts 2026 earnings growth of 300% for Korea and 45% for Taiwan, driven by a semiconductor memory supercycle tied to hyperscaler demand and AI compute.[9] The report describes Korea’s earnings trajectory as potentially the strongest for any Asian market since recovery from the Asian Financial Crisis in 1999. In Taiwan, technology accounts for approximately 80% of the Taiwan Stock Exchange Index weight, making it function largely as an AI hardware proxy rather than a diversified emerging market exposure.[1]
By contrast, other Asian markets, including China, India, Indonesia and the Philippines, significantly underperformed Korea and Taiwan over the same period.[1] Investors accessing broad MSCI Emerging Markets exposure are therefore carrying a concentrated position in the AI hardware cycle, with the remainder of the index providing limited earnings upgrade support. The EAFE improvement, at 4.35%, is broad-based. Equity markets in Japan, Canada, the UK, and Europe all posted returns exceeding 30% in USD terms from January 2025 through May 2026, supporting the case that the improvement is arguably more durable as it is less dependent on a single earnings driver.[1]
The 2025 rotation reflected three converging forces: first, a policy shock that exposed the fragility of a decade of concentrated U.S. positioning; second, mechanical amplifiers, principally dollar weakness and positioning unwind, that translated modest fundamental shifts into substantial performance gaps and third, structural reforms across European and Asian markets that had arguably been building for years but remained underpriced.
Portfolio Considerations
Meeder’s tactical mutual fund strategies maintain diversified allocations across U.S., Developed International, and Emerging Market equities. We adjust allocations within that range based on trend, valuation, and fund flow factors and, since mid-2025, our research has resulted in a relatively consistent tilt toward Non-U.S. equities across these funds
Developed International (EAFE) offers a meaningfully different risk profile than U.S. equities. The primary return drivers for EAFE, namely European fiscal expansion, defense procurement, and Japanese and Korean corporate governance reform, are structurally independent of the AI capex cycle. In a scenario where AI spending disappoints, EAFE could experience a smaller drawdown than EM, and its fundamental earnings drivers would remain relatively intact. While EAFE is not entirely without AI exposure, its exposure is considerably less than EM. In a scenario where the AI theme accelerates further from current levels, EAFE could underperform both U.S. equities and EM on a relative basis.
Emerging Markets, by contrast, carry a more direct line to the AI capex cycle. A meaningful share of the index—Taiwan Semiconductor, Samsung Electronics, and SK Hynix among them—sits at the center of AI chip fabrication and memory production, giving EM investors direct exposure to the compute layer that U.S. equities largely lack. In addition to its AI exposure, EM is also impacted by China’s policy and property cycle, India’s domestic consumption growth, and Latin America’s commodity and rate cycles. Nevertheless, the weight of Northeast Asian semiconductor exposure means EM’s aggregate earnings picture is more AI-sensitive than EAFE’s.
This distinction has important implications for portfolio construction. An international allocation weighted toward EAFE can provide genuine factor diversification relative to existing U.S. equity exposure, as the dominant risk drivers are different. Conversely, an international allocation weighted toward EM offers AI supply chain diversification within the same thematic, with different geographic and political risk but with meaningful overlap in the underlying earnings driver.
Key Global Risks to Monitor
AI CAPEX DISAPPOINTMENT
The earnings trajectories of both U.S. and EM equities share a critical dependency: the continuity of AI capital expenditure. EM’s earnings momentum is heavily concentrated in Taiwanese and Korean semiconductor manufacturers, while U.S. growth remains tied to the Magnificent Seven, both of which rely on sustained hyperscaler spending. Any reduction in AI capex guidance could therefore present a correlated drawdown risk across both markets, undermining the diversification benefits of rotating from U.S. to EM equities. EAFE remains relatively insulated, as its primary earnings drivers are structurally independent of the AI spending cycle.
DOLLAR REVERSAL
Approximately one-third of MSCI EAFE’s 2025 USD return was attributable to currency translation.[1] A dollar recovery of similar magnitude would mechanically impair international returns for U.S.-based investors even if underlying equity markets continue to perform well. A reversal could potentially be triggered by U.S. economic data surprising to the upside.
GEOPOLITICAL ESCALATION
The Iran war presents a potentially asymmetric risk for energy-importing economies such as Japan, South Korea, India, China, and Europe. A severe supply disruption could introduce inflationary pressures with broad economic consequences, weighing on corporate margins and consumer spending. Separately, a military escalation in Taiwan could significantly disrupt the global AI supply chain.
EUROPEAN FISCAL EXECUTION
The primary risk in Europe is the delay between government spending commitments and corporate earnings delivery. Defense procurement bureaucracy, coalition political friction, and EU member state disagreements on ReArm allocation could all extend the announcement-to-earnings timeline. While the structural direction remains intact, the risk is one of timing. The prolonged Iran war adds a monetary headwind, with rising energy costs potentially pressuring non-defense corporate margins even as defense and infrastructure spending remain insulated by fiscal mandates.
CHINA STRUCTURAL DETERIORATION
At approximately 20% of the MSCI EM Index,[13] a resumption of property sector deterioration or deepening deflation would suppress broad Emerging Market returns even if the Korea and Taiwan AI thesis performs as expected.
[1] Meeder Asset Management Research
[2] Shifting Tides in Global Markets: The Reemergence of International Investing
[3] World Gold Council: Why Central Banks are Buying Gold Again
[4] The next AI stock winners may be overseas
[5] BIS Bulletin No. 122. Global giants in the AI supply chain
[6] Why Latin America’s equities are capturing global attention
[7] Asia stock markets outlook for 2026: Hang Seng and Nikkei forecasts
[8] South Korea’s Rising Governance Tide: How to Ride the Value-Up Wave
[9] Korea’s Stock Market Is Forecast to Set Fresh Highs
[10] European defense stocks: The magnitude of Europe’s rearmament remains underappreciated
[11] What Germany’s fiscal shakeup means for markets
[12] The debt brake: Germany in a crisis of uncertainty
[13] MSCI Emerging Markets Factsheet June 2026
Commentary offered for informational and educational purposes only. Opinions and forecasts regarding markets, securities, products, portfolios, or holdings are given as of the date provided and are subject to change at any time. No offer to sell, solicit, or recommend any security or investment product is intended. Certain information and data has been supplied by unaffiliated third parties as indicated. Although Meeder believes the information is reliable, it cannot warrant the accuracy, timeliness or suitability of the information or materials offered by third parties.
INDEX DESCRIPTIONS AND DEFINITIONS
Clients cannot invest directly in these indexes and the actual yield for any portfolio invested consistently with the illustration will vary from the hypothetical data shown here. Unmanaged Index returns do not reflect any advisory fees or expenses.
Korea Composite Stock Price Index (KOSPI): Measures the performance of all common shares listed on the Korea Exchange (KRX). Nikkei 225 Index: Measures the performance of 225 large-capitalization companies listed on the Tokyo Stock Exchange Prime Market. MSCI ACWI Index: Captures large- and mid-cap representation across 23 developed market and 24 emerging market countries. The index covers approximately 85% of the global investable equity opportunity set. MSCI EAFE Index: The MSCI EAFE (Europe, Australasia, and Far East) Index is an equity index that captures large- and mid-cap representation across 21 developed market countries, excluding the U.S. and Canada. The index covers approximately 85% of the free float-adjusted market capitalization in each country. MSCI EM Index: This emerging markets index captures large- and mid-cap representation across 24 emerging market countries. The index covers approximately 85% of the free float-adjusted market capitalization in each country. S&P 500 Index: A market-capitalization-weighted index designed to measure the performance of 500 large-capitalization companies listed on U.S. stock exchanges and covers approximately 80% of available U.S. market capitalization. S&P 500 Aerospace & Defense Index: Measures the performance of companies within the S&P 500 classified in the aerospace and defense sub-industry under the Global Industry Classification Standard (GICS). STOXX Aerospace and Defense Index: Measures the performance of European companies classified within the aerospace and defense industry under the Industry Classification Benchmark (ICB). STOXX 600 Europe Index: Measures the performance of 600 large-, mid-, and small-capitalization companies across 17 European countries. The Taiwan Stock Exchange Weighted Index: A capitalization-weighted index of all listed common shares traded on the Taiwan Stock Exchange. Hyperscalers: Large technology companies such as Amazon, Microsoft and Google that operate massive cloud and AI infrastructure at global scale. Global AI giants: Nvidia, Apple, Alphabet, Microsoft, Amazon, Meta, Tesla, OpenAI, Oracle, Palantir, AMD, Anthropic, Cisco, Alibaba, Tencent, ByteDance, TSMC, Samsung, SK Hynix, and ASML.
Investment advisory services offered by Meeder Asset Management, Inc. and Meeder Advisory Services, Inc
©2026 Meeder Investment Management, Inc.
0289-MAS-8/25/26-54530