You are now leaving Meeder Investment Management. Links to other websites are provided for your convenience and information only. When you click on a link to another website you will be leaving this website. The fact that Meeder Investment Management provides links to other websites does not mean that we endorse, authorize or sponsor the linked website, or that we are affiliated with that website’s owners or sponsors. This material is being provided for informational purposes only and is not a solicitation or an offer to buy any security or to participate in any planning or investment strategy. Unless otherwise indicated, the linked sites are not under our control and we are not responsible for and assume no liability for the content or presentation of any linked site or any link contained in a linked site, or any changes or updates to such sites. We make no representations about the accuracy or completeness of the information contained in any linked sites and their privacy and security policies may differ from ours. We recommend that you review this third-party’s policies and terms carefully.
August 2025: Capital Markets Commentary

August Lifts Both Stocks and Bonds
Federal Reserve and the Economic Outlook
Equity Markets: Small Caps
Regain Leadership
Fixed Income
Looking Ahead
August Lifts Both Stocks and Bonds
Equities continued to show resilience, with small-cap stocks leading gains on stronger-than-expected earnings and optimism around Fed policy easing. Large-cap performance was more muted, as technology shares cooled after their strong run earlier in the year. In fixed income, global investors balanced the push-and-pull of elevated inflation and softer labor data, while international markets benefited from a weaker U.S. dollar and ongoing demand.
Federal Reserve and the Economic Outlook
The Federal Reserve remains front and center. Chair Powell’s Jackson Hole remarks in late August set clear expectations for a 25 basis point rate cut at the September 16–17 FOMC meeting. Despite inflation still running above target, the Fed’s preferred PCE measure climbed to 2.6% in July, matching the same reading from June. However, weakening labor data is shaping policy: August marked the fourth consecutive month of sub-100,000 job gains, the softest stretch since the pandemic.
Encouragingly, corporate fundamentals remain resilient. S&P 500 revenues continue to outpace cost growth by nearly 2% year-over-year, leading to consistent profit margins for large U.S. companies. With inflation cooling from its 2022–2023 peaks and the yield curve now normalized, strong corporate earnings with the expectation of lower interest rates has led to higher equity returns.
KEY FED INFLATION REPORT STILL ABOVE FED TARGET
As of July 31, 2025
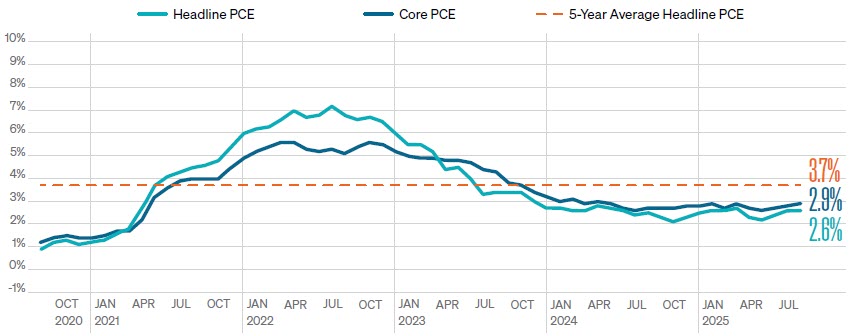
SOURCE: BUREAU OF ECONOMIC ANALYSIS, MORNINGSTAR.COM
Equity Markets: Small Caps Regain Leadership
Equity markets posted strong performance in August. U.S. small-cap stocks led the charge, with the
Russell 2000 outperforming the S&P 500 by more than 5% for the month. The index now sits less than
2% from all-time highs not seen since late 2021. Investor enthusiasm was fueled by expectations of Fed
easing and stronger-than-anticipated Q2 earnings, particularly in cyclical and growth-sensitive sectors.
Large-cap equities were still positive, with the S&P 500 gaining more than two percent. International
equities had another very strong month, with the MSCI EAFE Index rallying 4.3%. Emerging market
equities benefited from both attractive valuations, a weakening U.S. dollar and global investors’ renewed
appetite for yield.
Fixed Income
Lower rates in anticipation of the next Fed cut created a strong tailwind for fixed income securities as
well. Weakening labor market data and expectations of a September Fed rate cut helped anchor a parallel
shift down of the yield curve. The Bloomberg U.S. Aggregate Bond Index gained 1.2%, while Emerging
market debt remained a bright spot with a 1.6% return, supported by attractive spreads and improving
fundamentals across several regions.
Looking Ahead
The interplay of Fed policy, fiscal uncertainty, and tariff rulings will dominate the September narrative. While risks remain elevated, especially if debt issuance accelerates or shutdown negotiations stall, our outlook is balanced. With equity momentum still positive, corporate fundamentals solid, and global central banks tilting toward easing, we maintain our constructive but disciplined stance.
Commentary offered for informational and educational purposes only. Opinions and forecasts regarding markets, securities, products, portfolios, or holdings are given as of the date provided and are subject to change at any time. No offer to sell, solicit, or recommend any security or investment product is intended. Certain information and data has been supplied by unaffiliated third parties as indicated. Although Meeder believes the information is reliable, it cannot warrant the accuracy, timeliness or suitability of the information or materials offered by third parties.
Investors cannot invest directly in an index. The performance of any index is not indicative of the performance of any investment and does not take into account the effects of inflation and the fees and expenses associated with investing.
INDEX DESCRIPTIONS
S&P 500 Index: The S&P 500 Index tracks the stock performance of 500 of the largest publicly traded companies in the United States. It represents approximately 80% of total U.S. market capitalization and is widely regarded as the best single gauge of large-cap U.S. equities.
Russell 2000 Index: The Russell 2000 Index measures the performance of approximately 2,000 small-cap U.S. companies. It is a subset of the Russell 3000 Index and serves as a benchmark for small-cap investing.
MSCI EAFE Index: The MSCI EAFE (Europe, Australasia, and Far East) Index captures large- and mid-cap performance across 21 developed markets, excluding the U.S. and Canada. It is commonly used to benchmark international developed equity performance.
Bloomberg U.S. Aggregate Bond Index: The Index is a broad-based flagship benchmark that measures the investment-grade, U.S. dollardenominated, fixed-rate taxable bond market. The index includes Treasuries, government-related and corporate securities, fixed-rate agency MBS, ABS, and CMBS (agency and non-agency). Provided the necessary inclusion rules are met, U.S. Aggregate-eligible securities
also contribute to the multi-currency Global Aggregate Index and the U.S. Universal Index. The U.S. Aggregate Index was created in 1986, with history backfilled to January 1, 1976.
Investment advisory services offered by Meeder Advisory Services, Inc.
©2025 Meeder Investment Management, Inc.
0289-MAS-9/17/25-52587