You are now leaving Meeder Investment Management. Links to other websites are provided for your convenience and information only. When you click on a link to another website you will be leaving this website. The fact that Meeder Investment Management provides links to other websites does not mean that we endorse, authorize or sponsor the linked website, or that we are affiliated with that website’s owners or sponsors. This material is being provided for informational purposes only and is not a solicitation or an offer to buy any security or to participate in any planning or investment strategy. Unless otherwise indicated, the linked sites are not under our control and we are not responsible for and assume no liability for the content or presentation of any linked site or any link contained in a linked site, or any changes or updates to such sites. We make no representations about the accuracy or completeness of the information contained in any linked sites and their privacy and security policies may differ from ours. We recommend that you review this third-party’s policies and terms carefully.
» Inflation and the Fed
» Labor Market Cooling
» Yield Curve and Interest Rates
» Housing
» Institute of Supply Management
» Looking Forward

For the first time in a long time, investors saw Large Cap Value stocks outperform their Growth peers on a relative basis. As of August 31, 2024, the Russell 1000 Value Index posted a monthly return of +2.68%, outpacing the Russell 1000 Growth Index, which gained +2.08% for the same period. Year-to-date, growth stocks are still ahead with a return of +21.12%, compared to +15.08% for value stocks. However, the recent shift in momentum towards value and away from growth-oriented technology stocks could indicate changing market sentiment.
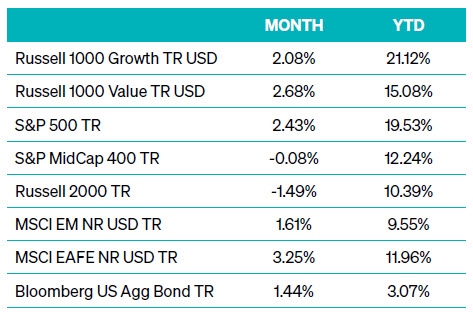
Away from the equity market, fixed-income investors experienced turbulence in early August as spreads widened, reflecting the growing economy. However, the bond market saw a turnaround in the latter part of the month.. This recovery propelled the Barclays U.S. Aggregate Index to post a solid gain of +1.44% for August, boosting its year-to-date return to +3.07%. The late-month rally provided a much-needed reprieve for bondholders as investor sentiment improved amidst easing inflation and clearer expectations from the Fed.
Since March 2022, the Fed has raised interest rates 11 times, pushing the overnight lending rate to a range of 5.25%–5.50%. This aggressive tightening has created the most restrictive real Federal Funds rate since 2007. While the Fed projects the long-term neutral rate to be between 3% and 3.5%, the pace and timing of future rate hikes are uncertain.
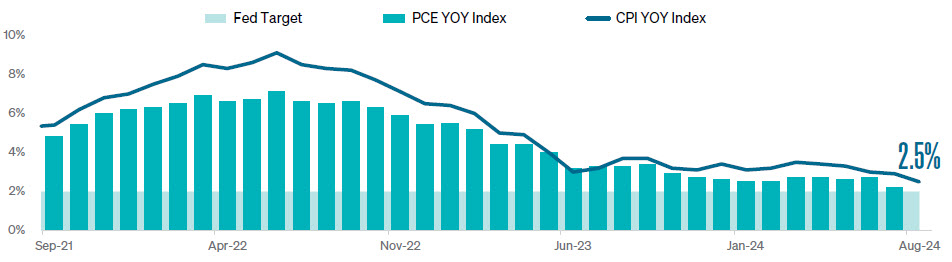
In his speech at the Jackson Hole symposium, Fed Chair Jerome Powell acknowledged the cooling labor market but emphasized a cautious approach. He stated, “We do not seek or welcome further cooling in labor market conditions. The time has come for policy to adjust.” This statement underscores the delicate balance the Fed must strike between managing inflation and sustaining employment.
While broader equity markets have delivered strong returns, the divergence in performance across sectors and market capitalizations highlights the need for vigilance and diversification. As the Fed navigates the delicate balance between controlling inflation and supporting economic growth, investors should remain prepared for potential volatility and be ready to adjust their portfolios accordingly.
The views expressed herein are exclusively those of Meeder Investment Management, Inc., are not offered as investment advice, and should not be construed as a recommendation regarding the suitability of any investment product or strategy for an individual’s particular needs. Investment in securities entails risk, including loss of principal. Asset allocation and diversification do not assure a profit or protect against loss. There can be no assurance that any investment strategy will achieve its objectives, generate positive returns, or avoid losses.
Commentary offered for informational and educational purposes only. Opinions and forecasts regarding markets, securities, products, portfolios, or holdings are given as of the date provided and are subject to change at any time. No offer to sell, solicitation, or recommendation of any security or investment product is intended. Certain information and data has been supplied by unaffiliated third parties as indicated. Although Meeder believes the information is reliable, it cannot warrant the accuracy, timeliness or suitability of the information or materials offered by third parties.
Investment advisory services provided by Meeder Asset Management, Inc.
INDEX DESCRIPTIONS
Bloomberg US Aggregate Bond Index: The Index is a broad-based flagship benchmark that measures the investment-grade, US dollardenominated, fixed-rate taxable bond market. The index includes Treasuries, government-related and corporate securities, fixed-rate agency
MBS, ABS, and CMBS (agency and non-agency). Provided the necessary inclusion rules are met, US Aggregate-eligible securities also
contribute to the multi-currency Global Aggregate Index and the US Universal Index. The US Aggregate Index was created in 1986, with history
backfilled to January 1, 1976.
MSCI EAFE Index: The Index is an equity index that captures large and mid-cap representation across 21 Developed Markets countries
around the world, excluding the US and Canada. With 783 constituents, the index covers approximately 85% of the free float-adjusted market
capitalization in each country.
MSCI EM Index: The Index captures large and mid-cap representation across 24 Emerging Markets (EM) countries. With 1,440 constituents,
the index covers approximately 85% of the free float-adjusted market capitalization in each country.
Russell 1000 Growth: The index measures the performance of the large-cap growth segment of the US equity universe. It includes those
Russell 1000 companies with relatively higher price-to-book ratios, higher I/B/E/S forecast medium-term (2 year) growth and higher sales per
share historical growth (5 years). The index is completely reconstituted annually.
Russell 1000 Value Index: The index measures the performance of the large-cap value segment of the US equity universe. It includes those
Russell 1000 companies with relatively lower price-to-book ratios, lower I/B/E/S forecast medium-term (2 years) growth, and lower sales per
share historical growth (5 years). The index is completely reconstituted annually.
Russell 2000 Index: The Index is constructed to provide a comprehensive, unbiased barometer of the small-cap segment of the US equity
market. A subset of the Russell 3000 Index, it includes approximately 2,000 of the smallest securities based on a combination of their market
cap and current index membership.
S&P 400 MidCap Index: This index serves as a gauge for the U.S. mid-cap equities sector and is the most widely followed mid-cap index.
To be included in the index, a stock must have a total market capitalization between $5.8 billion and $15.8 billion.
S&P 500 Index: The Index tracks the stock performance of 500 of the largest companies listed on stock exchanges in the United States.
It is one of the most followed equity indices and includes approximately 80% of the total market capitalization of U.S. public companies.
©2024 Meeder Investment Management, Inc.
0116-MAM-9/16/24-44663