You are now leaving Meeder Investment Management. Links to other websites are provided for your convenience and information only. When you click on a link to another website you will be leaving this website. The fact that Meeder Investment Management provides links to other websites does not mean that we endorse, authorize or sponsor the linked website, or that we are affiliated with that website’s owners or sponsors. This material is being provided for informational purposes only and is not a solicitation or an offer to buy any security or to participate in any planning or investment strategy. Unless otherwise indicated, the linked sites are not under our control and we are not responsible for and assume no liability for the content or presentation of any linked site or any link contained in a linked site, or any changes or updates to such sites. We make no representations about the accuracy or completeness of the information contained in any linked sites and their privacy and security policies may differ from ours. We recommend that you review this third-party’s policies and terms carefully.
» How Will Tariffs Impact the Economy?
» Inflation & The Fed

A 10% tariff was imposed broadly, with significantly higher effective rates targeting key trading partners. Analysts estimate that this policy shift will push the U.S. effective tariff rate to 25%, reaching a level not seen since the pre-WWII era. The stock market responded with one of its most severe short-term selloffs over a two-day period in history. From April 2–4, the S&P 500 fell over 10%, joining only three instances of a magnitude this great in just two days since 1952. These occurrences included Black Monday in 1987, the 2008 financial crisis, and the COVID-19 pandemic economic shutdown in 2020.
Inflation surveys conducted before the tariff announcement already hinted at building pressure. The Richmond Fed’s business inflation expectations rose above 7% over the next six months, reaching the highest level in decades. Similarly, the University of Michigan’s one-year consumer inflation outlook climbed to nearly 5%, well above the Federal Reserve’s 2% target.
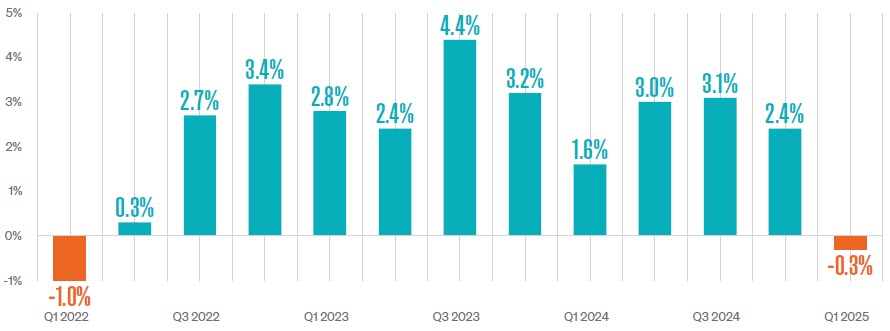
This is important because perception drives consumer behavior and influences their spending behavior today, and more than two-thirds of the U.S. economy is driven by consumer spending. Therefore, it is not a surprise that GDP growth contracted by an annualized rate of -0.3% in the first quarter. While consumer spending showed no signs of a significant slowdown in the first quarter, U.S. companies sharply increased imports ahead of the expected tariffs and imports detract from the economic growth calculation. It was the first time GDP declined since the first quarter of 2022. On a positive note, domestic demand showed an annualized increase of 3%. These indicators are expected to rise further in the wake of the tariff announcement, complicating the Fed’s path forward.
Commentary offered for informational and educational purposes only. Opinions and forecasts regarding markets, securities, products, portfolios, or holdings are given as of the date provided and are subject to change at any time. No offer to sell, solicit, or recommend any security or investment product is intended. Certain information and data has been supplied by unaffiliated third parties as indicated. Although Meeder believes the information is reliable, it cannot warrant the accuracy, timeliness or suitability of the information or materials offered by third parties.
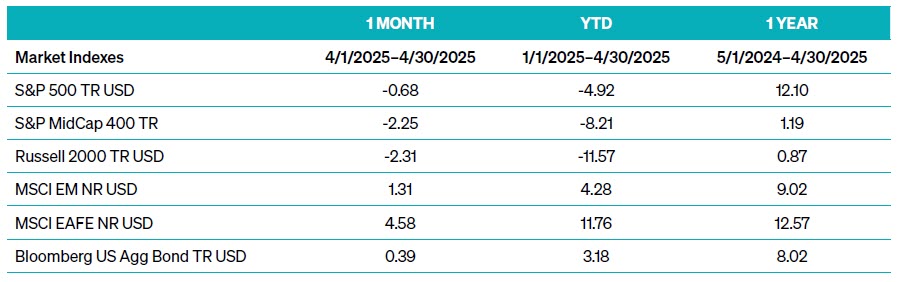
Investors cannot invest directly in an index. The performance of any index is not indicative of the performance of any investment and does not take into account the effects of inflation and the fees and expenses associated with investing.
INDEX DESCRIPTIONS
S&P 500 Index: The Index tracks the stock performance of 500 of the largest companies listed on stock exchanges in the United States. It is one of the most followed equity indices and includes approximately 80% of the total market capitalization of U.S. public companies.
S&P 400 Index: The S&P MidCap 400® provides investors with a benchmark for mid-sized companies. The index, which is distinct from the large-cap S&P 500®, is designed to measure the performance of 400 mid-sized companies, reflecting the distinctive risk and return characteristics of this market segment.
Russell 2000 Index: The Index is constructed to provide a comprehensive, unbiased barometer of the small-cap segment of the U.S. equity market. A subset of the Russell 3000 Index, it includes approximately 2,000 of the smallest securities based on a combination of their market cap and current index membership.
MSCI EM Index: The Index captures large and mid-cap representation across 24 Emerging Markets (E.M.) countries. With 1,440 constituents, it covers approximately 85% of each country’s free float-adjusted market capitalization.
MSCI EAFE Index: The Index is an equity index that captures large and mid-cap representation across 21 Developed Markets countries* worldwide, excluding the U.S. and Canada. With 783 constituents, the index covers approximately 85% of each country’s free float-adjusted market capitalization. MSCI EM Index: The Index captures large and mid-cap representation across 24 Emerging Markets (E.M.) countries. With 1,440 constituents, it covers approximately 85% of each country’s free float-adjusted market capitalization.
Bloomberg U.S. Aggregate Bond Index: The Index is a broad-based flagship benchmark that measures the investment-grade, U.S. dollar-denominated, fixed-rate taxable bond market. The index includes Treasuries, government-related and corporate securities, fixed-rate agency MBS, ABS, and CMBS (agency and non-agency). Provided the necessary inclusion rules are met, U.S. Aggregate-eligible securities also contribute to the multi-currency Global Aggregate Index and the U.S. Universal Index. The U.S. Aggregate Index was created in 1986, with history backfilled to January 1, 1976.
Investment advisory services offered by Meeder Advisory Services, Inc.
©2025 Meeder Investment Management, Inc.
0289-MAS-5/13/25-50252