October 2022
3Q22: Private Wealth Commentary

Each of the past quarters we’ve been highlighting one of the key attributes of Meeder Private Wealth SMAs. This quarter we want to focus on the importance of utilizing a solution that is actively managing for taxes. For many investors, last year was a great year regarding market returns. However, there was a surprise when they received their tax bills. In fact, the amount of non-payroll taxes paid last year was twice the amount paid in 2021 and the highest amount in decades.

By: Angelo Manzo, CFA®, CAIA, CFP®, Vice President, Private Wealth – Investments

TAXES PAID BY U.S. HOUSEHOLDS (IN BILLIONS)
SOURCE: CNBC, PENN WHARTON BUDGET MODEL ESTIMATES REFLECT 2021 DOLLARS, ADJUSTED FOR INFLATION BASED ON THE PERSONAL CONSUMPTION EXPENDITURES PRICE INDEX.
A major contributor to higher taxes were capital gains distributions in 2021. While planning for the impact of taxes in 2022 we are faced with a prospect of many mutual funds having a negative return for the year, yet still creating a high amount of capital gains distributions. This presents that dreaded scenario where the mutual fund portfolio is down for the year, yet it still creates a large tax bill. We call this the “double whammy.”

DOUBLE WHAMMY!
Capital Gains and Equity Returns January 2001–September 2022
SOURCE: MORNINGSTAR DIRECT, U.S. STOCKS: RUSSELL 3000 INDEX, U.S. EQUITY FUNDS: MORNINGSTAR BROAD CATEGORY U.S. EQUITY, ALL OTHER CATEGORIES ARE BASED ON MORNINGSTAR CATEGORY GROUP EACH INCLUDING MUTUAL FUNDS AND ETFS. FOR YEARS 1990 THROUGH 2013, USED OLDEST SHARE CLASS, 2014 FORWARD INCLUDES ALL SHARE CLASSES. AVERAGE CAPITAL GAIN DISTRIBUTION PERCENTAGE=CALENDAR YEAR CAP GAIN DISTRIBUTION ÷YEAR-END NAV (FOR YEARS 2001 THROUGH 2020). INDEXES ARE UNMANAGED AND CANNOT BE INVESTED IN DIRECTLY. RETURNS REPRESENT PAST PERFORMANCE AND ARE NOT A GUARANTEE OF FUTURE PERFORMANCE AND ARE NOT INDICATIVE OF ANY SPECIFIC INVESTMENT. ALL DATA AS OF 9/30/2022 EXCEPT 2022 MID-YEAR CAPITAL GAIN DISTRIBUTION TABLE WHICH IS AS OF 9/9/2022.
As you look at this chart, you can see historically, even in down markets like 2008 and 2018, mutual funds still had capital gains distributions. In 2008 capital gains distributions averaged 8% and 2018 capital gains distributions averaged 11%. Now we still don’t know what this year’s capital gains distribution numbers will be, but all signs point to it being in double digits.

IT’S PAY-UP TIME
10 Widely Held Funds Have Lost Investors Money This Year, But Still Carry Significant Taxable Gains
SOURCE: MORNINGSTAR DIRECT, BARRONS. POTENTIAL CAPITAL GAINS EXPOSURE DATA ARE AS OF THE LATEST ANNUAL REPORT. FUND FLOW ESTIMATES ARE AS OF AUGUST 31, 2022. YTD RETURNS ARE THROUGH SEPTEMBER 19, 2022
When we review some popular funds that are down for the year, you can see they still have very large percentages of embedded capital gains. The other area that you’re going to want to review is each fund’s flows. In this case, each of those flows are negative. That means that the fund is forced to sell positions to raise dollars to be paid for those redemptions. Those redemptions often create taxable capital gains for the funds that are out of the mutual fund manager’s control. Remember, a mutual fund is a pooled investment vehicle.

At Meeder Private Wealth we are utilizing separately managed accounts. Unlike a mutual fund where everyone has the same experience, in Private Wealth accounts, the portfolio is built specifically for each client. Each client has control by owning the cost basis on all the underlying positions. With Private Wealth, other investors’ behavior no longer impacts your tax bill. This year the volatility has been high, and the market is down pretty much across the board. This market volatility has presented opportunities for actively tax loss harvesting across our accounts, turning what would be for many, a tax cost into an actual tax benefit. Now is the time to review your accounts that contain mutual funds and ETFs. Because of the market decline, many clients may not have as large of a tax bill to move out of those funds and into a Private Wealth account. Making the move to Private Wealth allows for greater tax control going forward.

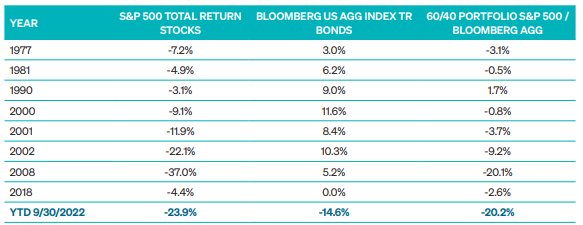
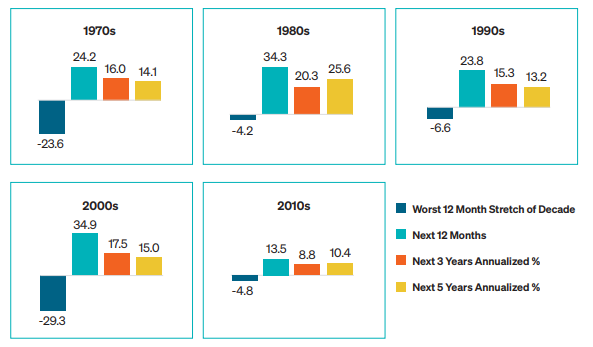
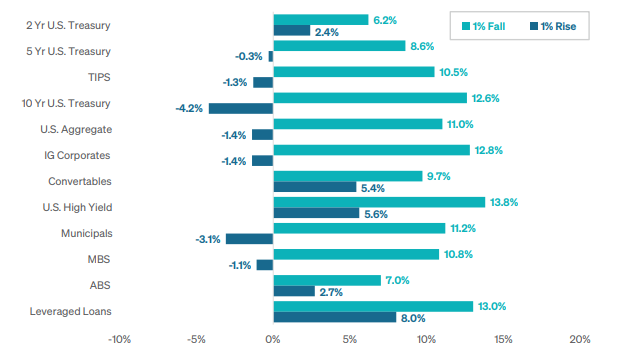
It has been a challenging year for equity and fixed income markets. Since 1977, there have been only 8 down years in the S&P 500. In each of these years where the S&P 500 experienced negative returns, the fixed income market represented by the Bloomberg U.S. Aggregate Index provided diversification and income to offset the equity downside. The challenge this year has been the negative performance of fixed income which has resulted in greater downside participation. 

S&P DOWN YEARS AND BOND RETURNS
SOURCE: BLOOMBERG
The S&P 500 is down near -24%, and the fixed income market is down nearly -15%. The negative performance in equity and fixed income markets has led to greater downside participation for more balanced investors. Looking back at history, we can see how balanced portfolios have fared after challenging markets. 

IS THE 60/40 PORTFOLIO DEAD?
Worst 1-Year Return (%) of the…
SOURCE: RUSSELL; 60/40 PORTFOLIO COMPRISED OF 40% S&P 500 INDEX, 20% MSCI EAFE INDEX, 40% BLOOMBERG AGGREGATE BOND INDEX
Here are the last five decades showing the returns for 60/40 portfolios. It shows the worst 1-year decline for a 60/40 portfolio and then shows the subsequent 1-year, 3-year and 5-year returns following the decline. The current market performance is not as bad as those declines in the 1970s or 2000s. In each case, a longer time horizon proved to reward investors.

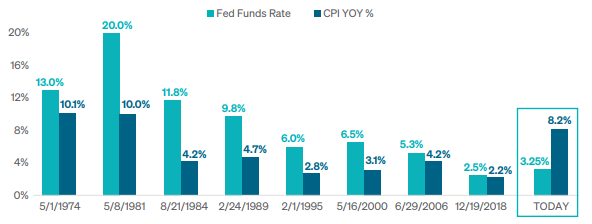
The Fed’s attempt to rein in inflation, remains the number one concern for investors. One way to try and analyze this is to view what the Fed has done from a historical perspective during other rising rate periods. The chart shows the peak Fed Funds rates and inflation represented by CPI year-over-year when the Fed reached the peak rate. If you look back from 1974 to today during the past eight tightening cycles, the Fed did not stop raising rates until the Federal Funds rate was higher than inflation. Today, the Fed Funds rate is at 3.25% and inflation at 8.2%. It is likely that interest rates will continue to climb and peak at a level above CPI. 

THE FED ISN’T CLOSE TO STOPPING?
Historically Tightening Cycles End When Fed Funds Rate is Above CPI
SOURCE: STRATEGAS
Here we see the S&P 500 returns combined with the presidential cycle. Mid-term years have historically been challenging and 2022 has played out to historical trends. We are concluding that very challenging 6 month period where you see 2.2%. We are coming into what has historically been a very strong period for equities. From a seasonality perspective, this is a positive for equities. 

S&P RETURNS AND PRESIDENTIAL CYCLES COMBINED
SOURCE: LEUTHOLD
There have been many questions around fixed income. Our current approach is a blend of core and opportunistic pending the account registration. The core portfolio consists of Treasuries, investment grade municipals, and investment grade corporates. The role of the core portfolios to provide income stability and offset the risk of the equity allocation. The key risk within the core portfolio is interest rate risk. The opportunistic allocation consists of high yield, multi-sector or possibly preferred bonds. Opportunistic provides far greater income, but there is greater risk, also higher correlation to the equity market. Within opportunistic, we are willing to spend our fee budget and we also prefer more tactical and active managers with the ability to shift allocations across the credit spectrum and across the yield curve. We are currently overweight core today. We are finding much better value from a risk return perspective relative to opportunistic. 

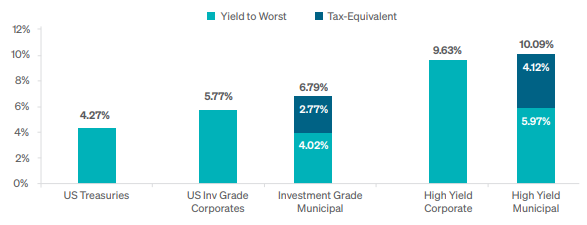
Below are the yields across several core investments as well as high yield. U.S. Treasuries are yielding over 4%, investment grade corporates nearly 6% and investment grade municipals nearly 7% for your clients in the highest federal tax bracket. We are finding core investments very attractive today. We maintain a high yield allocation, but we would argue that there may be a better buying opportunity in the future. High yield has held up very well given the equity weakness. Should we see additional credit stress, there may be a better a buying opportunity which we will be equipped to capture.

FIXED INCOME OPPORTUNITY?
Tax Equivalent Yields, as of 9/27/22
SOURCE: MAINSTAY
Here we show the impact of a 1% rise or 1% fall in interest rates. The next nine months will likely look very different than the previous nine. The key reasons are due to the significant rise in income across the portfolio. Due to the higher yield buffer, the upside/downside returns for an equivalent 1% move in interest rates is tilted toward the upside. Due to higher income in fixed income, portfolios have favorable yields and lower downside participation. We have favorable income within our core allocation with minimal risk.

IMPACT OF 1% RISE OR FALL IN INTEREST RATES
Tax Equivalent Yields, as of 9/27/22
SOURCE: J.P. MORGAN
It’s important to stay disciplined in the volatile market environment. Volatility creates opportunity for those clients who can weather the storm. We need to acknowledge that we will get through this market volatility and there will be opportunities created from the dislocations. Our team will continue to position portfolios that are likely to benefit from recent price action. 

WHAT IS MEEDER PRIVATE WEALTH?
Meeder Private Wealth is our customized separately managed account (SMA) which is managed with a strategic investment discipline. As we look at the core components of private wealth, it is important to note that we have a vast ability to personalize. This is not a one size fits all approach. Each client is unique; they have their own goals and objectives, so each portfolio is built specifically to that client’s unique situation. Additionally, as we move through time and the client’s goals and objectives change, Private Wealth has the flexibility to adjust and change as needed.

For risk management we take a holistic approach; we want to know as much about each client’s financial situation as possible. The more information we have about their entire financial picture the more effectively we can manage their investments and ensure we are maintaining their specific risk profile. We can manage around concentrated positions, excluding stocks, sectors, or industries. All this information can be considered and allows our team to build the portfolio to be as effective and efficient as possible while maintaining the agreed-upon risk profile.

An area that we would consider to be one of the most underserved from a portfolio management standpoint is tax management, which often represents a large part of our conversations with advisors and clients. We implement active and ongoing tax-loss harvesting, as well as gain deferral when needed. The tax loss harvesting isn’t simply selling stocks that are down at the end of the quarter or the end of the year. This is a more thoughtful approach where every account is reviewed daily to determine if there are opportunities within the portfolio to harvest losses. This active tax management allows us to maximize after-tax wealth for our clients and generate tax alpha.

Finally, this is a transparent and unbiased approach. While Meeder does offer a full suite of mutual funds, we do not use any proprietary products inside of private wealth. Also, the clients will always be able to see in real-time the positions that are being held in the account, along with access to our investment team as needed to answer any questions that may arise. 

The views expressed herein are exclusively those of Meeder Investment Management, Inc., are not offered as investment advice, and should not be construed as a recommendation regarding the suitability of any investment product or strategy for an individual’s particular needs. Investment in securities entails risk, including loss of principal. Asset allocation and diversification do not assure a profit or protect against loss. There can be no assurance that any investment strategy will achieve its objectives, generate positive returns, or avoid losses.

Commentary offered for informational and educational purposes only. Opinions and forecasts regarding markets, securities, products, portfolios, or holdings are given as of the date provided and are subject to change at any time. No offer to sell, solicitation, or recommendation of any security or investment product is intended. Certain information and data has been supplied by unaffiliated third parties as indicated. Although Meeder believes the information is reliable, it cannot warrant the accuracy, timeliness or suitability of the information or materials offered by third parties.

Investment advisory services provided by Meeder Asset Management, Inc.

©2022 Meeder Investment Management, Inc.

0183-MAS-10/26/22-28064