You are now leaving Meeder Investment Management. Links to other websites are provided for your convenience and information only. When you click on a link to another website you will be leaving this website. The fact that Meeder Investment Management provides links to other websites does not mean that we endorse, authorize or sponsor the linked website, or that we are affiliated with that website’s owners or sponsors. This material is being provided for informational purposes only and is not a solicitation or an offer to buy any security or to participate in any planning or investment strategy. Unless otherwise indicated, the linked sites are not under our control and we are not responsible for and assume no liability for the content or presentation of any linked site or any link contained in a linked site, or any changes or updates to such sites. We make no representations about the accuracy or completeness of the information contained in any linked sites and their privacy and security policies may differ from ours. We recommend that you review this third-party’s policies and terms carefully.
» Labor Markets
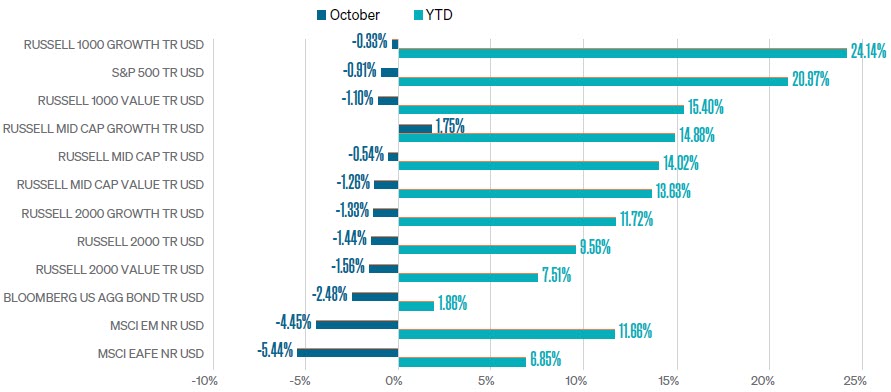
» Market Performance Review
» Inflation Moderates
» Slower GDP Growth
» ISM Levels Diverge

One outlier was growth-oriented segments within mid-cap equities that experienced positive returns, with the Russell Mid-Cap Growth Index up 1.75% in October. This increase was primarily due to its higher weighting to technology and industrials that benefitted from the Fed’s declining interest rate expectations.
Bonds struggled as the Bloomberg U.S. Aggregate Bond Index declined 2.48%, underscoring ongoing pressures from higher yields on the longer end of the yield curve and a stronger U.S. dollar. Global equities showed pronounced weakness, with the MSCI Emerging Markets Index falling by 4.45% and the MSCI EAFE Index, which captures developed international markets, down 5.44%.
The views expressed herein are exclusively those of Meeder Investment Management, Inc., are not offered as investment advice, and should not be construed as a recommendation regarding the suitability of any investment product or strategy for an individual’s particular needs. Investment in securities entails risk, including loss of principal. Asset allocation and diversification do not assure a profit or protect against loss. There can be no assurance that any investment strategy will achieve its objectives, generate positive returns, or avoid losses.
Commentary offered for informational and educational purposes only. Opinions and forecasts regarding markets, securities, products, portfolios, or holdings are given as of the date provided and are subject to change at any time. No offer to sell, solicitation, or recommendation of any security or investment product is intended. Certain information and data has been supplied by unaffiliated third parties as indicated. Although Meeder believes the information is reliable, it cannot warrant the accuracy, timeliness or suitability of the information or materials offered by third parties.
Investment advisory services provided by Meeder Asset Management, Inc.
INDEX DESCRIPTIONS
Russell 1000 Growth: The index measures the performance of the large-cap growth segment of the US equity universe. It includes those Russell 1000 companies with relatively higher price-to-book ratios, higher I/B/E/S forecast medium-term (2 year) growth and higher sales per share historical growth (5 years). The index is completely reconstituted annually.
S&P 500 Growth Index: The Index measures constituents from the S&P 500 that are classified as growth stocks based on three factors: sales growth, the ratio of earnings change to price, and momentum.
S&P 500 Index: The Index tracks the stock performance of 500 of the largest companies listed on stock exchanges in the United States. It is one of the most followed equity indices and includes approximately 80% of the total market capitalization of U.S. public companies.
S&P 500 Value Index: The index measures constituents from the S&P 500 that are classified as value stocks based on three factors: the ratios of book value, earnings and sales to price.
Russell 1000 Value Index: The index measures the performance of the large-cap value segment of the US equity universe. It includes those Russell 1000 companies with relatively lower price-to-book ratios, lower I/B/E/S forecast mediumterm (2 years) growth, and lower sales per share historical growth (5 years). The index is completely reconstituted annually.
The Russell Midcap® Growth Index: The index measures the performance of the midcap growth segment of the US equity universe. It includes those Russell Midcap Index companies with relatively higher price-to-book ratios, higher I/B/E/S forecast medium term (2 year) growth and higher sales per share historical growth (5 years). The Index isconstructed to provide a comprehensive and unbiased barometer of the mid-cap growth market and is completely reconstituted annually.
The Russell Midcap® Index: The index is a subset of the Russell 1000® Index. It includes approximately 800 of the smallest securities based on a combination of their market cap and current index membership. The Russell Midcap® Index represents approximately 27% of the total market capitalization of the Russell 1000® companies, as of the most recent reconstitution. The Russell Midcap Index is constructed to provide a comprehensive and unbiased barometer for the mid-cap segment. The index is completely reconstituted annually.
The Russell Midcap® Value Index: The index measures the performance of the midcap value segment of the US equity universe. It includes those Russell Midcap Index companies with relatively lower price-to-book ratios, lower I/B/E/S forecast medium term (2 year) growth and lower sales per share historical growth (5 years). The Russell Midcap Value Index is constructed to provide a comprehensive and unbiased barometer of the mid-cap value market. The index is completely reconstituted annually.
Russell 2000 Growth Index: The index measures the performance of the small-cap growth segment of the US equity universe. It includes those Russell 2000 companies with relatively higher price-to-book ratios, higher l/B/E/S forecast medium term (2 year) growth and higher sales per share historical growth (5 years). The Russell 2000 Growth Index is constructed to provide a comprehensive and unbiased barometer for the small-cap growth segment. The index is completely reconstituted annually to ensure new and growing equities are included and that the represented companies continue to reflect growth characteristics.
Russell 2000 Index: The Index is constructed to provide a comprehensive, unbiased barometer of the small-cap segment of the U.S. equity market. A subset of the Russell 3000 Index, it includes approximately 2,000 of the smallest securities based on a combination of their market cap and current index membership.
Russell 2000 Value Index: The Index measures the performance of the smallcap value segment of the US equity universe. It includes those Russell 2000 companies with relatively lower price-to-book ratios, lower I/B/E/S forecast medium term (2 year) growth and lower sales per share historical growth (5 years). The Russell 2000 Value Index is constructed to provide a comprehensive and unbiased barometer for the small-cap value segment. The index is completely reconstituted annually to ensure new and growing equities are included and that the represented companies continue to reflect value characteristics.
MSCI EAFE Index: The Index is an equity index that captures large and mid-cap representation across 21 Developed Markets countries* worldwide, excluding the U.S. and Canada. With 783 constituents, the index covers approximately 85% of each country’s free float-adjusted market capitalization. MSCI EM Index: The Index captures large and mid-cap representation across 24 Emerging Markets (E.M.) countries. With 1,440 constituents, it covers approximately 85% of each country’s free float-adjusted market capitalization.
Bloomberg U.S. Aggregate Bond Index: The Index is a broad-based flagship benchmark that measures the investment-grade, U.S. dollar-denominated, fixed-rate taxable bond market. The index includes Treasuries, government-related and corporate securities, fixed-rate agency MBS, ABS, and CMBS (agency and non-agency). Provided the necessary inclusion rules are met, U.S. Aggregate-eligible securities also contribute to the multi-currency Global Aggregate Index and the U.S. Universal Index. The U.S. Aggregate Index was created in 1986, with history backfilled to January 1, 1976.
©2024 Meeder Investment Management, Inc.
0116-MAM-11/12/24-46089