July 2022
Q2 2022 Quarterly Commentary: President's Perspective
The S&P 500 Index officially reached bear market territory
after finishing the second quarter down more than -20% from
its all-time high set on January 3rd. It was the worst first-half
performance for the S&P 500 since 1970. Bonds, represented
by the Bloomberg Aggregate Index could not escape the
carnage either as they also finished June down more than
-10% YTD.
By: Aaron Adkins, CFP® ChFC CLU, Investment Communications Strategist
MARKET UPDATE
MARKET UPDATE
The S&P 500 Index officially reached bear market territory after finishing the second quarter down more than -20% from its all-time high set on January 3rd. It was the worst first-half performance for the S&P 500 since 1970. Bonds, represented by the Bloomberg Aggregate Index could not escape the carnage either as they also finished June down more than -10% YTD. This was just the third time since 1981 that stocks and bonds experienced two consecutive quarters of negative performance. Prior to that, the most recent occurrence was during the Financial Crisis of 2008.

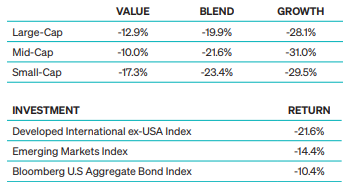
The second quarter was a continuation of many of the same themes as the first quarter this year, as illustrated in Figure 1. Value stocks outperformed their Growth peers and Large-caps generally outperformed Small-caps. When looking at the 9 style boxes, the performance of each of Russell’s 9 equity style indexes were negative. S&P sectors only had Energy produce positive performance year-to-date, up more than 30%. Utilities, Consumer Staples, and Health Care sectors each had single-digit losses year-to-date. The remaining sectors have experienced negative performance year-to-date, down anywhere from 16-32%. International markets suffered too, just as the global supply chain issues continue to struggle to meet demand.
YTD PERFORMANCE THROUGH JUNE 30, 2022
SOURCE: Morningstar Direct; Bloomberg; Large Value: Russell 1000 Value TR Index, Large Blend: S&P 500 Index TR, Large Growth: Russell 1000 Growth Index TR, Mid Value: Russell Midcap Value Index TR, Mid Blend: Russell Midcap Index TR, Mid Growth: Russell Midcap Growth Index TR, Small Value: Russell 2000 Value Index TR, Small Blend: Russell 2000 Index TR, Small Growth: Russell 2000 Growth Index TR. Developed International: STOXX Global 1800 ex-USA Index TR, Emerging Markets: STOXX Emerging Markets 1500 Index TR
FEDERAL RESERVE
FEDERAL RESERVE
The Fed is trying to restore credibility with the marketplace after dismissing inflationary trends as just being transitory for nearly a year. The Fed took bold action after seeing inflation reach a 40-year high and increased the federal funds rate by 0.75% on June 15, making it the largest single rate increase since 1994. This brought the overnight lending rate between banks to a range of 1.50%-1.75%. The committee is currently telegraphing that they will likely increase rates by an additional 0.75% at their July meeting. The Fed is predicting that the federal funds target rate at the end of 2022 will be between 3.25% and 3.50%, which remains much higher than where rates currently sit. In June, the 10-Year Treasury yield closed above 3.49% for the first time since July 2011. It has also caused the spread between the 2 and 10-year Treasury maturities to invert. This occurs when the economic forecast looks unsteady and investors favor purchasing longer-term debt over short-term debt. They do this to try and lock in long-term bond yields to reduce risk. Historically, this has been a precursor to an economic recession. 
TREASURY YIELDS AND FEDERAL FUNDS RATE
SOURCE: FRED
POSSIBLE RECESSION?
RECESSION AROUND THE CORNER
Now that the Fed has committed to “do-whatever-it-takes to control inflation” and will be aggressively raising rates for the foreseeable future, investors are questioning if the economy has what it takes to rebound this time. As the Fed continues to tighten, the question remains, will the economy be able to continue to grow despite the dampening demand caused by an increase in interest rates? The first quarter of 2022 saw the U.S. economy unexpectedly contract by -1.6%. While the National Bureau of Economic Research is responsible for determining the official declaration of a recession, many investors follow the old methodology of two consecutive quarters of negative GDP growth as the definition of a recession. As interest rate increases continue to work their way into the economy, there are signs that some of the demand is already declining rapidly. For example, according to the U.S. Census Bureau, new housing starts declined by -14.4% from April to May.
SENTIMENT AT HISTORIC LOW
Consumers are feeling different about this bear market from others that have occurred in recent years. The University of Michigan Index of Consumer Sentiment survey for June reported a level of 50.0, making it an all-time low in the survey’s history since 1978. It was a substantial drop of more than -14% from May. Previously, investors knew that the Federal Reserve was ultimately backing up the stock market which is why some analysts believe that we had the V-shaped recoveries after the significant drawdowns we experienced in 2019 and 2020. 
RUSSIA AND UKRAINE WAR
As the war between Russia and Ukraine continues to drag on, Ukraine is defending itself on several fronts better than many expected. This unprovoked Russian attack led many countries, including the European Union, to ban the purchase of Russian oil exports. This sent the price of crude oil higher as demand already outweighed supply. Russia is the world’s second largest oil producer behind the U.S. and produces more than 9.4 million barrels per day. This shortage and continued supply chain issues were primary drivers in pushing inflation to reach 40-year highs.
RECESSION IMPACTING PORTFOLIOS
HOW IS THIS IMPACTING PORTFOLIOS?
At Meeder, we manage investment solutions across different risk profiles and time horizons. Meeder manages strategies using a systematic approach that guides us in the allocation of our portfolios. Many of these solutions employ one or more of our core investment strategies: Growth, Defensive Equity, and Fixed Income.
GROWTH
Investment portfolios comprised of the Growth Strategy maintain a more aggressive objective and typically remain invested in the stock market. In the second quarter, equity markets experienced significant volatility as the Russia and Ukraine War continued. This led many countries to ban the purchase of Russian oil exports, sending the price of crude oil higher and exacerbating supply chain disruptions. The Fed took bold action after seeing inflation a reach 40-year high and increased the federal funds rate by 0.75% on June 15 making it the largest single rate increase since 1994. This volatility caused the performance of nearly all equity markets to struggle. Investors that remained in the Growth Strategy experienced more volatility than our Defensive Equity strategies but achieved performance similar to the equity market as represented by the S&P 500 Index.
DEFENSIVE EQUITY
Portfolios that utilize the Defensive Equity Strategy follow a rules-based and data-driven approach using the Meeder Investment Positioning System (IPS) model. This investment model is used to determine the risk relative to the reward available in the marketplace and identify when we should be increasing or decreasing the portfolio’s equity exposure. At the beginning of the quarter, the strategy had a 70% allocation to equities. By the end of April, credit risk continued to rise, and inflation, interest rates, and geopolitical uncertainty weighed on the model score. The IPS model guided us to reduce our allocation to equities to 51%. In the middle of May, the long-term trends and momentum were very weak. Valuations remained elevated, causing us to reduce our equity allocation to as low as 32%. In early June our intermediate and short-term models became a little more positive due to the extreme number of flows into inverse bearish ETFs. We view this from a contrarian perspective and increased our equity exposure to 41%. For the remainder of the quarter, any improvement in the IPS model scores were essentially negated by the heightened volatility present in the marketplace. The defensive equity positioning throughout the quarter substantially reduced the market volatility experienced by investors relative to the equity market as measured by the S&P 500 Index. 
FIXED INCOME
The Meeder Fixed Income Strategy tactically shifts portfolio exposure utilizing our proprietary investment models. These models are designed to actively monitor factors to guide us in determining the credit quality, emerging market debt exposure, and the portfolio’s U.S. Treasury duration.

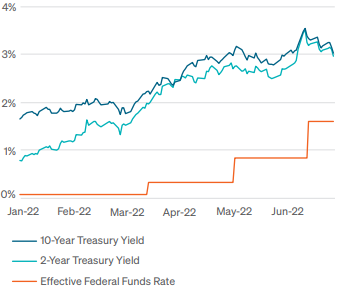
Meeder Fixed Income portfolios started the second quarter with exposure to high yield bonds, investment-grade bonds, short-term U.S. Treasuries, and cash. As market volatility increased early in the quarter, momentum and volatility factors in our credit model signaled risk-off sentiment and we reduced high yield positions in our portfolios, moving the proceeds to cash. We also extended portfolio duration from mid-May through mid-June, as momentum factors in our duration model indicated relative strength in longer duration Treasuries. As volatility subsided towards the end of May, macroeconomic, momentum and volatility factors in our credit and emerging markets led us to increase high yield and emerging market exposure briefly.

However, rate volatility in the fixed income markets continued to rise during the quarter and the Federal Reserve surprised the markets with a higher-than-expected, 0.75% rate hike on the federal funds rate in June. Our models ultimately guided us to exit high yield and emerging market positions in mid-June, increasing the cash position in our portfolios. Higher cash exposure helped our portfolios’ relative performance against market benchmarks on the downside during the quarter.

One-third of the portfolio remained invested in U.S. Investment grade securities throughout the quarter. At the end of the second quarter, we reduced High Yield and Emerging Market exposure and shortened the duration by raising cash.
LOOKING AHEAD
LOOKING AHEAD
Inflation will remain a very important issue for the global economy in the foreseeable future. This presents unique and challenging environment that we have not seen for more than 40 years. The good news is that we have seen inflationary times worse than this and have built our models with everything we learned since that time. While no two economic periods are the same, we will continue to make our investment decisions based on economic data and factors that remove emotion from the decision making process. We will continue to follow our disciplined process and rules-based approach to managing money and, as always, we thank you for trusting us to help you reach your financial goals.

Commentary offered for informational and educational purposes only. Opinions and forecasts regarding markets, securities, products, portfolios or holdings are given as of the date provided and are subject to change at any time. No offer to sell, solicitation, or recommendation of any security or investment product is intended. Certain information and data has been supplied by unaffiliated third-parties as indicated. Although Meeder believes the information is reliable, it cannot warrant the accuracy, timeliness or suitability of the information or materials offered by third-parties. Advisory services provided by Meeder Asset Management, Inc. and/or Meeder Advisory Services, Inc. Meeder Funds are distributed by Meeder Distribution Services, Inc., member FINRA.

©2022 Meeder Investment Management, Inc.                                                                                                                                                               

0107-MIM-7/14/22-26925