You are now leaving Meeder Investment Management. Links to other websites are provided for your convenience and information only. When you click on a link to another website you will be leaving this website. The fact that Meeder Investment Management provides links to other websites does not mean that we endorse, authorize or sponsor the linked website, or that we are affiliated with that website’s owners or sponsors. This material is being provided for informational purposes only and is not a solicitation or an offer to buy any security or to participate in any planning or investment strategy. Unless otherwise indicated, the linked sites are not under our control and we are not responsible for and assume no liability for the content or presentation of any linked site or any link contained in a linked site, or any changes or updates to such sites. We make no representations about the accuracy or completeness of the information contained in any linked sites and their privacy and security policies may differ from ours. We recommend that you review this third-party’s policies and terms carefully.

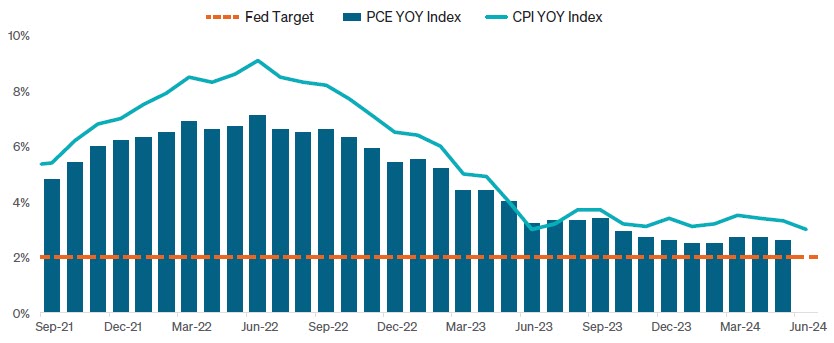
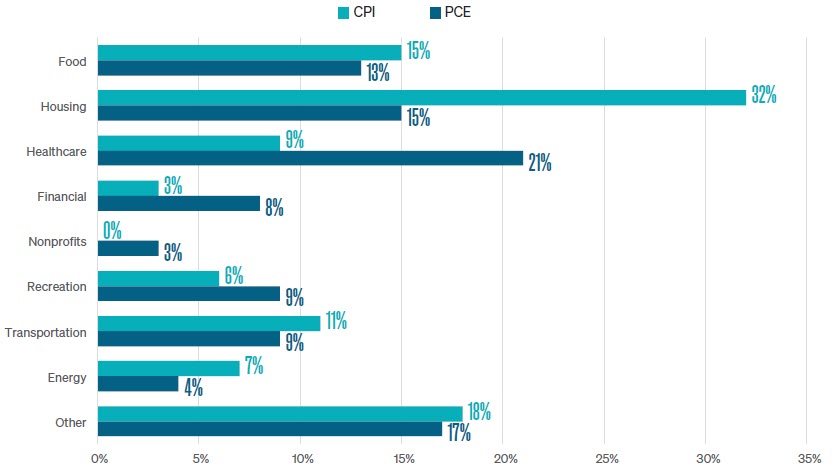
Despite these impressive performance milestones, other economic data remained mixed. Inflation indicators varied, as illustrated in Figure 1. June’s CPI report showed a 3.0% year-over-year increase, while May’s PCE index revealed a +2.7% year-over-year increase. There are significant differences when comparing the weightings between CPI and PCE, which is why the difference in monthly results exists. Figure 2 illustrates these weightings.
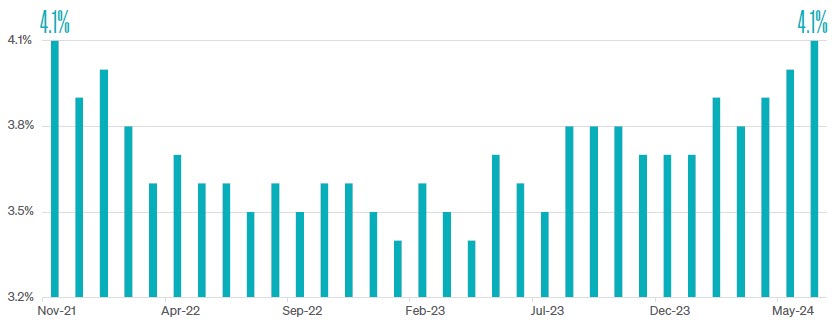
In June, the ISM Manufacturing PMI missed expectations with a result of 48.5, and the ISM Services PMI contracted to 48.8, falling short of consensus estimates. Both of these readings fell below 50, signifying a contraction in their respective industries. The labor market remained strong, with nonfarm payrolls increasing by 206,000, surpassing estimates of 190,000. However, U.S. unemployment unexpectedly climbed from 4.0% to 4.1%, marking the highest level since November 2021, as illustrated in Figure 3.
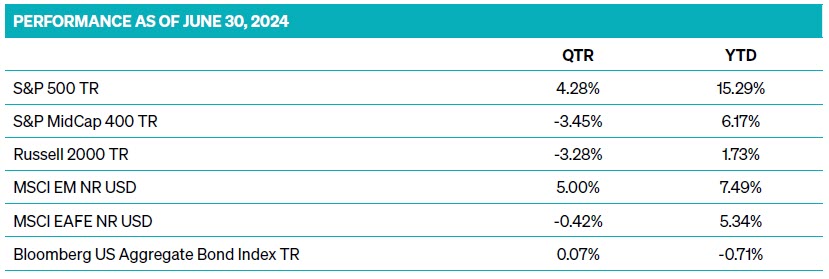
On the other hand, not all stocks benefited from the market’s rising tide, as higher interest rates negatively impacted smaller-cap interest rate-sensitive companies. Investor demand for small and mid-cap companies, as represented by the S&P MidCap 400 and Russell 2000 indices, declined more than
-3% in the second quarter.
Performance in the international markets diverged during the quarter. Emerging market stocks, represented by the MSCI EM Index, increased +5.0%. The performance of developed international stocks in the MSCI EAFE Index struggled and posted a return of -0.42% in the quarter.
provided substantial upside during the second quarter of 2024, benefiting from the market’s robust performance. The S&P 500 Index reached 31 new all-time highs in the first half of 2024, resulting in a +15.3% total return through June 30. Stocks focused on the creation or application of Artificial Intelligence led the way. Not all stocks benefited from the market’s rising tide as higher interest rates negatively impacted the real estate sector, making it the only S&P sector to experience negative performance through June 30. Market segments that were value-oriented and those that were more sensitive to interest rate changes and economic conditions struggled. Investors in the Meeder Growth Strategy experienced more volatility than other strategies, but those who remained invested achieved the highest returns in our portfolio suite.
The strategy began the second quarter with an equity exposure of 96%. Strong positive momentum and trend indicators kept the short-term model score robust despite inflationary pressures pushing the long-term model score into negative territory. Bearish options and fund flows provided a contrarian boost to the intermediate-term model score, reinforcing our cautious yet optimistic stance.
In April, market turbulence did not shake the underlying strength of the short-term model score, which consistently reflected positive trend and momentum factors. Bearish investor sentiment reached a six-month high in the middle of the month, marking a positive contrarian signal for our intermediate-term model, and it led us to increase our equity exposure to 100%.
The short-term model score remained strong in May, driven by robust market breadth and positive trend indicators. A softer than- expected jobs report and increasing expectations of Fed rate cuts in September sustained positive momentum. Significant equity fund outflows provided a positive contrarian signal for the intermediate-term model, while low volatility levels in both equity and bond markets supported a favorable outlook for equities.
June presented a more challenging landscape. The short-term model score remained strong, bolstered by positive market breadth and trend indicators. However, increasing bullish investor sentiment pushed the intermediate-term model score into neutral territory in early June. Reports of softer core CPI and weaker economic data led the market to price in a high likelihood of Fed rate cuts, adding a layer of complexity to our outlook. The combination of these events caused us to reduce our equity exposure to 95% in the middle of June. We further reduced equity exposure to 90% in the third week of June following poor market breadth and elevated valuations. The long-term model score improved in the final week of June as May’s PCE Index met market expectations and market risk declined. The combination of these factors led us to increase our equity exposure to 95% and remain at this allocation through the end of the second quarter.
At the beginning of the second quarter, we maintained an overweight position in high-yield relative to investment-grade debt. The forecast for rate cuts kept moving further into the future, limiting the potential for capital appreciation in higher-quality debt. We favored the carry (yield) on high-yield securities. Additionally, we held an overweight position in emerging market debt due to decreasing volatility, a weakening U.S. dollar, and significant price momentum in the sector. Our duration was shorter than the Bloomberg Aggregate Bond index by about one year, given robust growth prospects and reduced expectations for interest rate cuts until at least September.
Increased market volatility and a stronger U.S. dollar weakened our emerging market debt model score, prompting us to sell our position entirely in the third week of April. Near the end of the month, our fixed-income models identified an increase in volatility and rates, leading us to add a position in emerging market debt that was slightly underweight relative to the benchmark. Throughout this period, we maintained a shorter duration stance as the outlook for 2024 rate cuts was extended, with only two cuts expected, beginning in September.
Our stance on emerging market debt shifted to an overweight position by mid-May due to renewed sector momentum, a weakening dollar, and reduced market volatility. We also adjusted our duration strategy to a neutral stance relative to the Bloomberg Aggregate index. This adjustment was in response to downward momentum in yields and the Fed’s indications of no further rate hikes, with two cuts still priced in for the year.
As we moved into late May and throughout June, our overweight position in high-yield remained unchanged due to the continuous delay in rate cuts. We kept our overweight position in emerging market debt, supported by reduced market volatility and sector momentum. Our duration strategy remained neutral, reflecting the ongoing uncertainty in the interest rate path. This uncertainty continued through the end of June when the probability of a rate cut in September increased to roughly 65%. This outlook reaffirmed our neutral stance on duration, and we maintained our overweight allocation in high-yield and emerging market debt as the market navigated these uncertainties. Overall, the fixed income strategy for the second quarter of 2024 maintained a consistent overweight positioning in high-yield and dynamic adjustments in emerging market debt and duration.
Commentary offered for informational and educational purposes only. Opinions and forecasts regarding markets, securities, products, portfolios, or holdings are given as of the date provided and are subject to change at any time. No offer to sell, solicitation, or recommendation of any security or investment product is intended. Certain information and data has been supplied by unaffiliated third parties as indicated. Although Meeder believes the information is reliable, it cannot warrant the accuracy, timeliness or suitability of the information or materials offered by third parties. Investment advisory services provided by Meeder Asset Management, Inc.
INDEX DESCRIPTIONS
S&P 500 Index: The Index tracks the stock performance of 500 of the largest companies listed on stock exchanges in the United States. It is one of the most followed equity indices and includes approximately 80% of the total market capitalization of U.S. public companies.
S&P 400 MidCap Index: This index serves as a gauge for the U.S. mid-cap equities sector and is the most widely followed mid-cap index. To be included in the index, a stock must have a total market capitalization between $5.8 billion and $15.8 billion.
Russell 2000 Index: The Index is constructed to provide a comprehensive, unbiased barometer of the small-cap segment of the US equity market. A subset of the Russell 3000 Index, it includes approximately 2,000 of the smallest securities based on a combination of their market cap and current index membership.
MSCI EAFE Index: The Index is an equity index that captures large and mid-cap representation across 21 Developed Markets countries around the world, excluding the US and Canada. With 783 constituents, the index covers approximately 85% of the free float-adjusted market capitalization in each country.
MSCI EM Index: The Index captures large and mid-cap representation across 24 Emerging Markets (EM) countries. With 1,440 constituents, the index covers approximately 85% of the free float-adjusted market capitalization in each country.
Bloomberg US Aggregate Bond Index: The Index is a broad-based flagship benchmark that measures the investment-grade, US dollar-denominated, fixed-rate taxable bond market. The index includes Treasuries, government-related and corporate securities, fixed-rate agency MBS, ABS, and CMBS (agency and non-agency). Provided the necessary inclusion rules are met, US Aggregate-eligible securities also contribute to the multi-currency Global Aggregate Index and the US Universal Index. The US Aggregate Index was created in 1986, with history backfilled to January 1, 1976.
©2024 Meeder Investment Management, Inc.
0116-MAM-7/11/24-43322