You are now leaving Meeder Investment Management. Links to other websites are provided for your convenience and information only. When you click on a link to another website you will be leaving this website. The fact that Meeder Investment Management provides links to other websites does not mean that we endorse, authorize or sponsor the linked website, or that we are affiliated with that website’s owners or sponsors. This material is being provided for informational purposes only and is not a solicitation or an offer to buy any security or to participate in any planning or investment strategy. Unless otherwise indicated, the linked sites are not under our control and we are not responsible for and assume no liability for the content or presentation of any linked site or any link contained in a linked site, or any changes or updates to such sites. We make no representations about the accuracy or completeness of the information contained in any linked sites and their privacy and security policies may differ from ours. We recommend that you review this third-party’s policies and terms carefully.
Q3 2026 Quarterly Perspectives

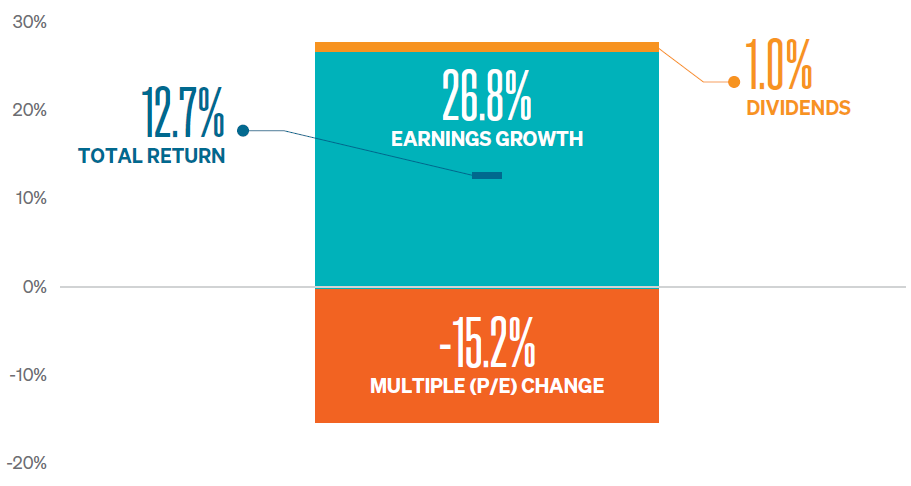
» Corporate earnings growth remains the primary driver of equity returns this year. S&P 500 earnings growth contributed 26.8% through September, while the S&P 500 Index experienced a 15.2% contraction in valuation multiples.
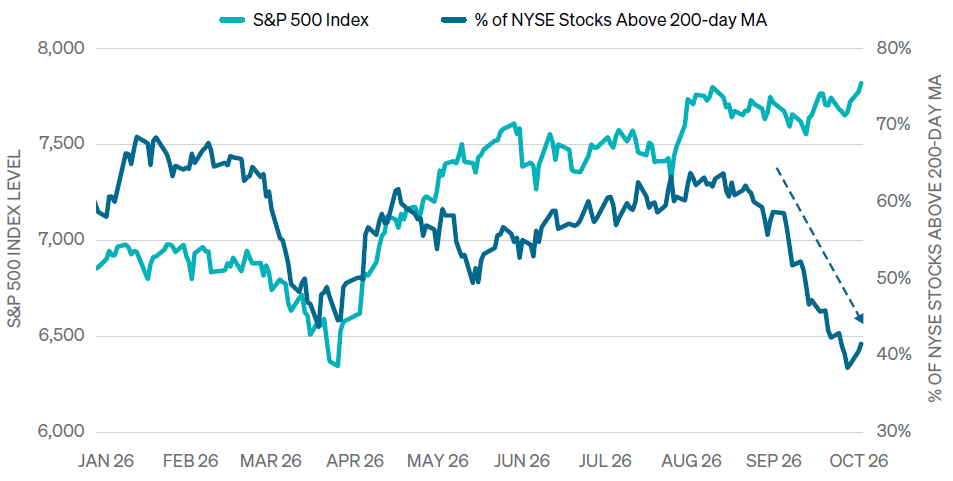
» Market breadth is deteriorating. While major indexes remain near their highs, more than 60% of NYSE-listed stocks were trading below their 200-day moving averages by early October.
» Higher interest rates and persistent inflation create headwinds. Treasury yields rose sharply during the quarter, pressuring bond returns and challenging equity valuations.
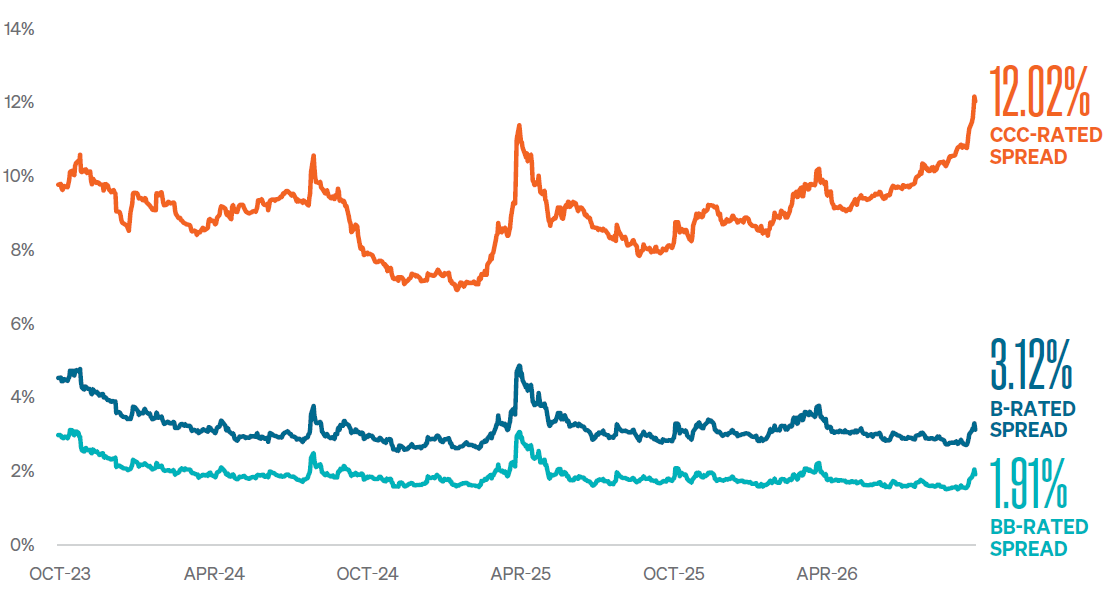
» Credit markets are showing signs of minor stress. High-yield spreads have widened, particularly among lower-quality borrowers.
» Our positioning is becoming slightly defensive. We have begun reducing risk while maintaining meaningful equity exposure.
Two-Speed Market:
Strong Fundamentals Meet Rising Headwinds
The third quarter of 2026 revealed a growing disconnect between the strength of the broader equity market and the underlying conditions supporting its advance. The S&P 500 Index returned 2.3% for the quarter, bringing its year-to-date gain to 12.7%, as robust corporate earnings and a resilient economy continued to support stock prices. Beneath the surface, however, market participation weakened; interest rates moved sharply higher, and credit markets began signaling increased risk.
For investors, the defining story of the quarter is an emerging two-speed market: strong fundamentals are providing a constructive foundation, while rising headwinds suggest a more challenging environment ahead. We believe the balance between these competing forces reinforces the importance of disciplined risk management and the flexibility to adapt as market conditions evolve.
Earnings Continue to Support the Market
One of the most encouraging developments in 2026 has been the strength of corporate earnings. Unlike periods when stock prices rise primarily because investors are willing to pay higher multiples, this year’s equity gains have been driven by underlying earnings growth.
Through September 30, the S&P 500 generated a total return of 12.7%. As shown in Exhibit 1, earnings growth has been the predominant driver of market returns. A market supported by earnings growth generally has a stronger fundamental foundation than one driven by expanding valuations and investor enthusiasm.
EXHIBIT 1:
EARNINGS DOING THE HEAVY LIFTING IN 2026
S&P 500 Total Return Decomposition, as of 9/30/2026
SOURCE: BLOOMBERG, AS OF SEP-26. THE PERFORMANCE DATA SHOWN REPRESENTS PAST PERFORMANCE, WHICH DOES NOT GUARANTEE FUTURE RESULTS.
The economic backdrop has also remained resilient. The Atlanta Fed’s GDPNow puts Q3 real GDP at 3.6% annualized as of October 8, a sharp acceleration from the second quarter. The labor market has cooled, not cracked. While the September job report showed an increase of only 29,000 jobs against expectations of 90,000 added, average hourly earnings rose just 0.1% and are up 3.0% from a year ago, lagging consumer inflation. The unemployment rate remains quite low at 4.2%; layoffs remain near historic lows, and Fed officials broadly describe the labor market as near full employment.
Investor sentiment provides another constructive signal. Although bearish sentiment has moderated from the extreme levels reached during the first quarter, investors have not become optimistic. Investors have plenty of scary headlines to digest this year: the Iran war, an energy-driven inflation shock, a suddenly hawkish Fed, bond yields at multi-decade highs, and doubts about AI infrastructure spending. All of this has resulted in most of our sentiment indicators reading somewhere between neutral and bearish during the third quarter—not something you typically see at major market tops.
Market Breadth Signals Growing Caution
While the backdrop is generally positive, the third quarter brought with it a few concerns we are paying attention to. Throughout the third quarter, the S&P 500 continued to advance while the number of participating stocks declined. By early October, more than 60% of NYSE-listed stocks were trading below their 200-day moving averages. The divergence was evident across market capitalizations: while the S&P 500 gained 2.3% during the quarter, the equal-weighted S&P 500 declined 1.9%, the S&P MidCap 400 fell 6.4%, and the Russell 2000 dropped 7.2%.
EXHIBIT 2:
MORE THAN 60% OF NYSE STOCKS ARE IN DOWNTRENDS
S&P 500 vs. NYSE Market Breadth (% of Stocks Above 200-Day Moving Average), 10/2/25–10/06/26
SOURCE: BLOOMBERG AS OF OCT-26. THE PERFORMANCE DATA SHOWN REPRESENTS PAST PERFORMANCE, WHICH DOES NOT GUARANTEE FUTURE RESULTS.
Market gains are increasingly concentrated among a smaller group of larger companies. Think of the market like a six-lane highway where four lanes are closed for construction. Under normal traffic conditions, things look fine. Cars are moving, and the average speed holds near 65 in both open lanes. But there is a fragility to this traffic flow under the surface. Narrow highways have two problems. On a six-lane highway, a minor accident barely slows things down, because traffic flows around it. The same is true if a car gets a flat tire. When only two lanes are open, one stalled car backs up traffic for miles. The second is that drivers may not trust the commute that depends on only two lanes. Drivers know a traffic jam is one accident away and may not participate as they normally would. That is why a single headline, like poor tech guidance or a flagship data center getting delayed, can move the whole market.
In today’s markets, the largest technology companies are keeping the traffic flow on these two lanes relatively stable. So, deteriorating breadth does not necessarily indicate that a significant decline is imminent, and divergences can persist for extended periods. We do believe, however, it puts the market at slightly higher risk than before the divergence emerged.
Higher Rates and Persistent Inflation Create New Challenges
The poor market breadth can be partly attributed to rapidly rising interest rates. U.S. Treasury yields moved sharply higher across the yield curve during the third quarter. From the beginning of July through early October, the two-year Treasury yield rose approximately 61 basis points to 4.79%, while the 10-year yield climbed approximately 76 basis points to its highest level since 2007. The 30-year Treasury yield reached 5.61%. Rising yields translated into losses for fixed income investors: the Bloomberg U.S. Aggregate Bond Index declined 3.5% during the quarter, while Emerging Market debt fell 4.4% and U.S. high-yield bonds declined 1.8%.
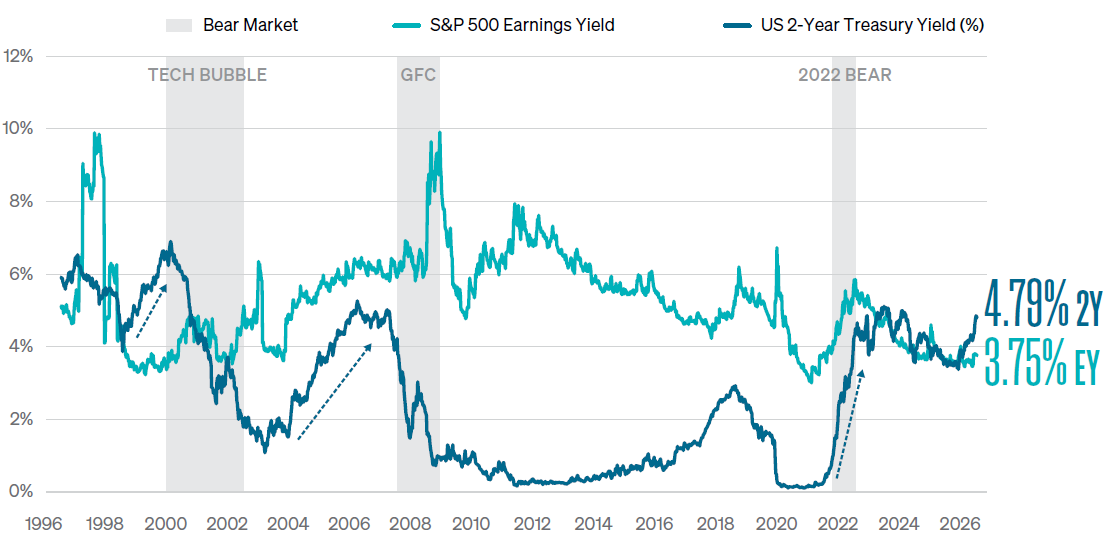
Higher rates also increase the relative attractiveness of fixed income while placing pressure on equity valuations. By early October, the two-year Treasury yield stood near 4.79%, compared with an S&P 500 earnings yield of approximately 3.75%. Although these measures are not directly equivalent, the comparison highlights the increasingly competitive return environment facing stocks.
EXHIBIT 3:
STOCKS NOW YIELD LESS THAN TREASURIES
S&P 500 Earnings Yield vs U.S. 2-Year Treasury Yield
SOURCE: BLOOMBERG AS OF OCT-26. THE PERFORMANCE DATA SHOWN REPRESENTS PAST PERFORMANCE, WHICH DOES NOT GUARANTEE FUTURE RESULTS.
Inflation remains another important consideration. The Personal Consumption Expenditures Price Index stood at approximately 3.42% in early October, above the Federal Reserve’s 2% target. The Fed also started raising rates again in September. With the federal funds rate near 3.88%, persistent inflation is likely to keep the Fed on a hawkish path for the near-term future. This combination presents a notable headwind even as economic growth and corporate earnings remain resilient.
Credit Markets Are Beginning to Show Stress
Beyond Treasury yields, credit markets are signaling a subtle shift in risk appetite. After remaining near historically tight levels earlier in the year, U.S. high-yield spreads widened from near-record low spreads to approximately 3.1% by early October. The deterioration has been most pronounced among lower-quality borrowers: CCC-rated spreads reached approximately 12.02%, their widest level since the 2023 regional banking crisis, compared with approximately 1.91% for BB-rated debt. These conditions do not necessarily indicate widespread financial distress, but they do suggest greater investor selectivity.
Exhibit 4:
LOWEST-QUALITY BONDS ARE SHOWING STRESS
CCC Debt Risk Premium Widest Since the 2023 Banking Crisis, as of 10/02/26
SOURCE: BLOOMBERG AS OF OCT-26. THE PERFORMANCE DATA SHOWN REPRESENTS PAST PERFORMANCE, WHICH DOES NOT GUARANTEE FUTURE RESULTS.
Portfolio Positioning:
Participating While Managing Risk
Our investment approach continues to emphasize flexibility, allowing portfolios to participate in favorable markets while responding systematically when risks increase. Throughout much of the second and third quarters, our Defensive Equity Strategy maintained substantial equity exposure and has been fully invested since mid-April. More recently, deteriorating breadth, elevated rates, and above-average bond market risk have led to a reduction in our equity allocation.
As of October 7, the Defensive Equity Strategy maintained a 90% equity exposure. That positioning reflects our view that fundamentals remain constructive, even as the balance of risks has become less favorable.
The dispersion in equity returns also presents opportunities within stock selection for our mutual funds. Within equities, our positioning continues to emphasize information technology, financials, healthcare, with diversified domestic and international exposure. Areas like technology hardware, semiconductors, biotechnology and diversified financials are industries we favor in this environment, while rate-sensitive industries like banks, utilities, and consumer staples have been areas we are underweight.
In fixed income, the Tactical Fixed Income Strategy maintained duration of approximately 5.3 years as of October 5, with 32% in U.S. Treasuries, 51% in other U.S. investment-grade securities, 11% in U.S. high yield, and 6% in emerging market debt. Our U.S. high-yield and emerging market debt positions were significantly reduced during early September. These adjustments reflect greater emphasis on credit quality and managing exposure to higher rates and widening spreads.
Looking Ahead:
A Constructive Foundation, but Less Room for Complacency
As we enter the final quarter of 2026, investors face a market supported by strong earnings and economic resilience but challenged by narrow leadership, elevated interest rates, persistent inflation, and early signs of credit deterioration.
The key consideration is not whether markets will continue to rise or experience a near-term correction. It is whether the balance between potential reward and risk remains favorable. The fundamental backdrop continues to support a constructive longer-term outlook, but the environment has become less forgiving. This isn’t a call for a major market top—right now it is simply a call to de-risk in our strategies relative to our prior positioning. Put another way, we just aren’t seeing a fat pitch in the markets that we observed in Q2.
Meeder’s investment process remains focused on evaluating the weight of the evidence, managing risk, and adapting systematically as conditions change. Our objective is not to predict every market movement, but to remain positioned to pursue opportunities while navigating the risks that accompany changing market cycles.
INDEX DESCRIPTIONS AND DEFINITIONS
Investors cannot invest directly in an index. The performance of any index is not indicative of the performance of any investment and does not take into account the effects of inflation and the fees and expenses associated with investing.
Bloomberg U.S. Aggregate Bond Index is a broad-based flagship benchmark that measures the investment-grade, U.S. dollar-denominated, fixedrate taxable bond market. The index includes Treasuries, government-related and corporate securities, fixed-rate agency MBS, ABS, and CMBS (agency and non-agency). Provided the necessary inclusion rules are met, U.S. Aggregate-eligible securities also contribute to the multi-currency Global Aggregate Index and the U.S. Universal Index. The U.S. Aggregate Index was created in 1986, with history backfilled to January 1, 1976. NYSE Composite is a stock market index covering all common stock listed on the New York Stock Exchange, including American depositary receipts, real estate investment trusts, tracking stocks, and foreign listings. It uses free-float market cap weighting. Over 2,000 stocks are covered in the index, of which over 1,600 are from United States corporations and over 360 are foreign listings; however foreign companies are very prevalent
among the largest companies in the index: of the 100 companies in the index having the largest market capitalization (and thus the largest impact on the index), more than half (55) are non-U.S. issues. Russell 2000 Index is constructed to provide a comprehensive, unbiased barometer of the small-cap segment of the U.S. equity market. A subset of the Russell 3000 Index, it includes approximately 2,000 of the smallest securities based on a combination of their market cap and current index membership. S&P 500 Index tracks the stock performance of 500 of the largest companies listed on stock exchanges in the United States. It is one of the most followed equity indices and includes approximately 80% of the total market capitalization of U.S. public companies. S&P 500 Equal Weight Index (EWI) is the equal-weight version of the widely-used S&P 500. The index includes the same constituents as the capitalization-weighted S&P 500, but each company in the S&P 500 EWI is allocated a fixed weight—or 0.2% of the index total at each quarterly rebalance. S&P 400 Index provides investors with a benchmark for mid-sized companies. The Index is designed to measure the performance of 400 mid-sized companies, reflecting the distinctive risk and return characteristics of this market segment.
Commentary offered for informational and educational purposes only. Opinions and forecasts regarding markets, securities,
products, portfolios, or holdings are given as of the date provided and are subject to change at any time. No offer to sell, solicit,
or recommend any security or investment product is intended. Certain information and data has been supplied by unaffiliated
third parties as indicated. Although Meeder believes the information is reliable, it cannot warrant the accuracy, timeliness or
suitability of the information or materials offered by third parties.
The views expressed herein are exclusively those of Meeder Investment Management, Inc., are not offered as investment
advice, and should not be construed as a recommendation regarding the suitability of any investment product or strategy
for an individual’s particular needs. Investment in securities entails risk, including loss of principal. Asset allocation and
diversification do not assure a profit or protect against loss. There can be no assurance that any investment strategy will
achieve its objectives, generate positive returns, or avoid losses.
Investors cannot invest directly in an index. The performance of any index is not indicative of the performance of any
investment and does not take into account the effects of inflation and the fees and expenses associated with investing.
Investment advisory services offered by Meeder Asset Management, Inc. and Meeder Advisory Services, Inc
©2026 Meeder Investment Management, Inc.
0289-MAS-10/14/26-54785