TOTAL RETURNS
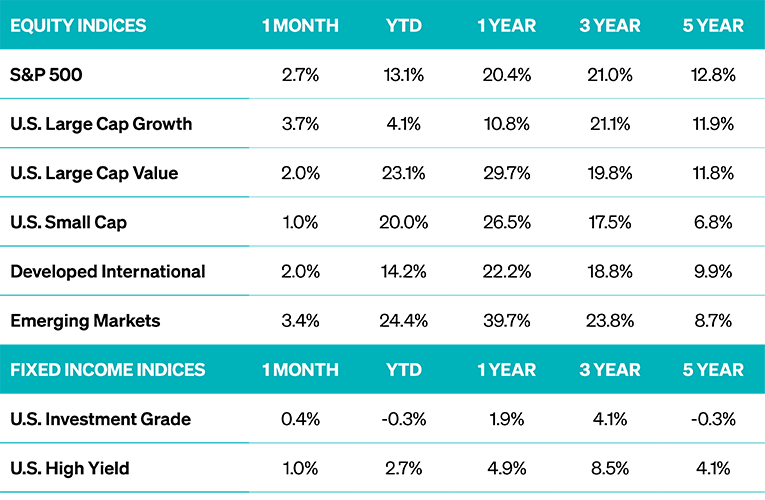
SOURCE: YCHARTS, MEEDER INVESTMENT RESEARCH AS OF 8/31/2026. THE PERFORMANCE DATA SHOWN REPRESENTS PAST PERFORMANCE, WHICH DOES NOT GUARANTEE FUTURE RESULTS.
INDICES: S&P 500 INDEX, RUSSELL 1000 GROWTH, RUSSELL 1000 VALUE, RUSSELL 2000, MSCI EAFE, MSCI EM, BLOOMBERG US AGG BOND, BLOOMBERG US CORPORATE HIGH YIELD
» U.S. equities gained across the board in August, and leadership swung back to growth after July’s reversal. Retreating rate-hike odds carried the S&P 500 to fresh records mid-month, while a standout quarter from Nvidia restored confidence in the AI capital spending cycle. Small caps set a record before Jackson Hole revived the threat of a hike.
» Emerging markets led again, more than recovering July’s semiconductor pullback as Asian chipmakers rallied on renewed AI demand. Developed international added a quieter gain, its fifth straight positive month. One sleeve has supplied the returns and the other the stability.
» Fixed income was quiet on the surface and anything but underneath. Long-dated yields jumped to multi-decade highs worldwide before the Treasury doubled its long-bond buybacks, then finished the month roughly unchanged. Duration contributed nothing, income did the work, and tight spreads let high yield outearn investment grade.
» Markets now debate whether the Fed’s next move is a hike rather than a cut, a question few were asking in January. Yet the advance rests on earnings rather than rising multiples, and the largest companies are not driving it. Leadership this broad rewards balance across styles, regions, and quality fixed income.
EMERGING MARKETS RALLIED, THE DISCOUNT WIDENED
MSCI EM FORWARD P/E DISCOUNT TO THE S&P 500: 2005–2026
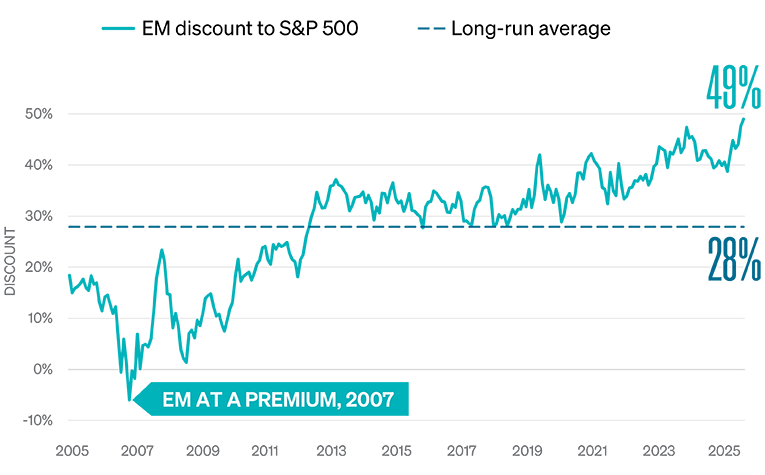
SOURCE: BLOOMBERG. BLENDED FORWARD 12-MONTH PRICE/EARNINGS RATIOS FOR THE MSCI EMERGING MARKETS INDEX (MXEF) AND S&P 500 INDEX (SPX), MONTH-END, USD, DECEMBER 2005 THROUGH AUGUST 2026. DISCOUNT IS CALCULATED AS ONE MINUS THE RATIO OF THE EM MULTIPLE TO THE S&P 500 MULTIPLE. FORWARD MULTIPLES REFLECT CONSENSUS ANALYST ESTIMATES, WHICH MAY NOT BE REALIZED. INVESTORS CANNOT INVEST DIRECTLY IN AN INDEX.
» Emerging markets ended August trading at 9.9 times forward earnings against 19.5 for the S&P 500. That 49% discount is the widest in at least twenty years and far above the 28% average since 2005. In 2007, the market paid more for emerging market earnings than for U.S. earnings.
» What makes it unusual is that the discount widened during a rally rather than a selloff. Emerging markets have led the major equity indexes over the past year and are cheaper against U.S. stocks today than a year ago, because earnings estimates climbed faster than prices.
» Valuation is a poor timing tool, and emerging markets have traded at a wide discount since 2013 without it closing. What has changed is that the fundamentals are improving alongside it, which puts the case abroad on earnings rather than a weakening dollar.
INDEX DESCRIPTIONS
Investors cannot invest directly in an index. The performance of any index is not indicative of the performance of any investment and does not take into account the effects of inflation and the fees and expenses associated with investing.
S&P 500 Index: The Index tracks the stock performance of 500 of the largest companies listed on stock exchanges in the United States. It is one of the most followed equity indices and includes approximately 80% of the total market capitalization of U.S. public companies. Russell 1000 Growth Index: The Index measures the performance of the large-cap growth segment of the US equity universe. It includes those Russell 1000 companies with relatively higher price-to-book ratios, higher I/B/E/S forecast medium-term (2-year) growth, and higher sales per share historical growth. The Index is constructed to provide a comprehensive and unbiased barometer for the large-cap growth segment. The index is completely reconstituted annually to ensure new and growing equities are included and that the represented companies continue to reflect growth characteristics. Russell 1000 Value Index: The Index measures the performance of the large-cap value segment of the US equity universe. It includes those Russell 1000 companies with relatively lower price-to-book ratios, lower I/B/E/S forecast medium-term (2 years) growth, and lower sales per share historical growth (5 years). The Index is constructed to provide a comprehensive and unbiased barometer for the large-cap value segment. The index is completely reconstituted annually to ensure new and growing equities are included and that the represented companies continue to reflect value characteristics. Russell 2000 Index: The Index is constructed to provide a comprehensive, unbiased barometer of the small-cap segment of the US equity market. A subset of the Russell 3000 Index, it includes approximately 2,000 of the smallest securities based on a combination of their market cap and current index membership. MSCI EAFE Index: The Index is an equity index that captures large and mid-cap representation across 21 Developed Markets countries* around the world, excluding the US and Canada. With 783 constituents, the index covers approximately 85% of the free float-adjusted market capitalization in each country. MSCI EM Index: The Index captures large and mid-cap representation across 24 Emerging Markets (EM) countries*. With 1,440 constituents, the index covers approximately 85% of the free float-adjusted market capitalization in each country. Bloomberg US Aggregate Bond Index: The Index is a broad-based flagship benchmark that measures the investment grade, US dollar-denominated, fixed-rate taxable bond market. The index includes Treasuries, government-related and corporate securities, fixed-rate agency MBS, ABS, and CMBS (agency and non-agency). Provided the necessary inclusion rules are met, US Aggregate-eligible securities also contribute to the multi-currency Global Aggregate Index and the US Universal Index. The US Aggregate Index was created in 1986, with history backfilled to January 1, 1976. Bloomberg US Corporate High Yield Bond Index: The Index measures the USD-denominated, high yield, fixed-rate corporate bond market. Securities are classified as high yield if the middle rating of Moody’s, Fitch and S&P is Ba1/BB+/BB+ or below. Bonds from issuers with an emerging markets country of risk, based on the indices’ EM country definition, are excluded. The US Corporate High Yield Index is a component of the US Universal and Global High Yield Indices. The index was created in 1998, with history backfilled to July 1, 1983.
IMPORTANT DISCLOSURES
The views expressed herein are exclusively those of Meeder Investment Management, Inc., are not offered as investment advice, and should not be construed as a recommendation regarding the suitability of any investment product or strategy for an individual’s particular needs. Investment in securities entails risk, including loss of principal. Asset allocation and diversification do not assure a profit or protect against loss. There can be no assurance that any investment strategy will achieve its objectives, generate positive returns, or avoid losses. The performance data shown represents past performance, which does not guarantee future results.
Commentary offered for informational and educational purposes only. Opinions and forecasts regarding markets, securities, products, portfolios, or holdings are given as of the date provided and are subject to change at any time. No offer to sell, solicit, or recommend any security or investment product is intended. Certain information and data has been supplied by unaffiliated third parties as indicated. Although Meeder believes the information is reliable, it cannot warrant the accuracy, timeliness or suitability of the information or materials offered by third parties.
Investment advisory services provided by Meeder Advisory Services, Inc.
©2026 Meeder Investment Management, Inc.
0373-MAS-9/10/26-54631
