ONE-MINUTE READ
» Rates and earnings pulled in opposite directions in Q3. The S&P 500 rose on strong profits, but nearly everything rate-sensitive, from small caps to core bonds, lost ground.
» Oil forced the Fed’s hand. Crude surged after the ceasefire collapsed, and Chair Kevin Warsh delivered the first hike since 2023, months after bonds priced it.
» The 10-year Treasury yield broke through 5% to its highest level since 2002, bruising bond prices but raising the starting yields that drive future returns.
» Breadth faded as AI leaders reclaimed the index, though the market remains less concentrated than during the megacap-led stretch from 2023 to 2025.
» Stocks got cheaper while going up. Earnings did all the work in every major region, with emerging markets showing the fastest growth and steepest reset.
» Midterm years tend to stall before the vote and rally after. 2026 never stalled, and the lasting lesson is to stay invested through the noise.
MARKET HIGHLIGHTS
» U.S. equities edged higher in Q3 on the back of AI leaders and an energy rally riding crude, while the average stock slipped. In a year defined by AI, value has stretched its lead over growth, since the gains pooled in chips while software, a big slice of the growth index, lagged. Small caps took the hardest hit as yields jumped, even as their earnings kept climbing.
» Emerging markets took a breather after leading the first half, as July’s chip selloff and a firmer dollar in September weighed. They remain the year’s best-performing equity market by a wide margin. Developed international edged ahead for the quarter but, like EM, trailed the S&P 500.
» Rising yields hit fixed income head-on, as the 10-year Treasury pushed through 5% and falling prices swamped income. The silver lining is that starting yields have historically been the best guide to future bond returns, making today’s losses a down payment on tomorrow’s income.
» Q3 asked diversified investors for patience. Size and geography trailed a narrow, AI-led index, but the earnings underneath kept improving, and over time prices tend to follow earnings rather than headlines.
THE BOND MARKET MOVED FIRST
SOURCE: MEEDER ADVISORY SERVICES, Y CHARTS, DATA AS OF SEPTEMBER 30, 2026. THE PERFORMANCE DATA SHOWN REPRESENTS PAST PERFORMANCE, WHICH DOES NOT GUARANTEE FUTURE RESULTS..
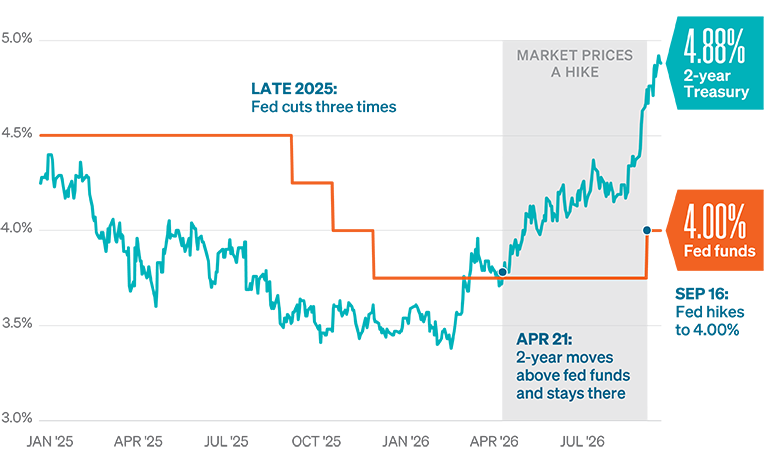
» The 2-year Treasury yield is the bond market’s running bet on where the Fed is headed. It sat below fed funds for more than a year, through three cuts in late 2025, pricing further easing.
» The oil shock flipped that bet, and after a false start in March, the 2-year crossed above fed funds on April 21 and never looked back, nearly five months before Chair Kevin Warsh hiked on September 16.
» The 2-year kept climbing after the hike, closing the quarter at 4.88%, nearly 90 basis points above the new 4.00% ceiling, with almost three-quarters of its Q3 rise coming in September alone.
» Officials expect more, with 16 of 18 projecting another hike, but the job market could cap how far they go. Hiring slowed to just 29,000 jobs in September and paychecks now trail prices. Meanwhile, cash and short-term bonds pay close to 5% again.
THE AVERAGE STOCK LOST ITS LEAD
SOURCE: FIRST TRUST ADVISORS, Y CHARTS, DATA AS OF SEPTEMBER 30, 2026. THE PERFORMANCE DATA SHOWN REPRESENTS PAST PERFORMANCE, WHICH DOES NOT GUARANTEE FUTURE RESULTS..
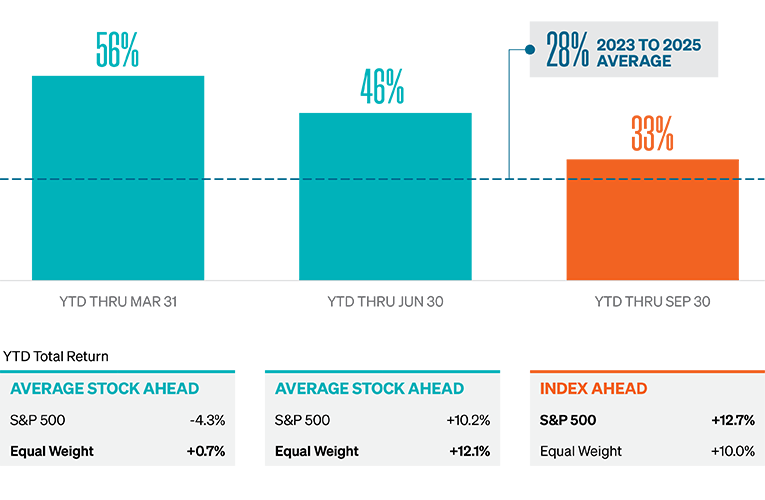
» The share of S&P 500 stocks beating the index this year slid from 56% through March to 46% through June and just 33% through September. The return gap flipped with it, as the index overtook equal weight 12.7% to 10.0%.
» Leadership swung back to AI, where tech now accounts for more than half of U.S. business investment, according to Yardeni Research. The companies on the receiving end carried the index while oil and rising yields weighed on nearly everything else.
» That 33% still tops the 2023 to 2025 average of 28%, a stretch when a few megacaps did most of the work, so breadth has faded without returning to those extremes.
» Narrow leadership cuts both ways. Chip stocks had their worst month since 2008 in July before roaring back, a preview of how hard a concentrated index can swing if AI spending disappoints, and the reason to look past the handful of names driving it.
STOCKS GOT CHEAPER WHILE GOING UP
SOURCE: MEEDER ADVISORY SERVICES, Y CHARTS, DATA AS OF SEPTEMBER 30, 2026. THE PERFORMANCE DATA SHOWN REPRESENTS PAST PERFORMANCE, WHICH DOES NOT GUARANTEE FUTURE RESULTS..
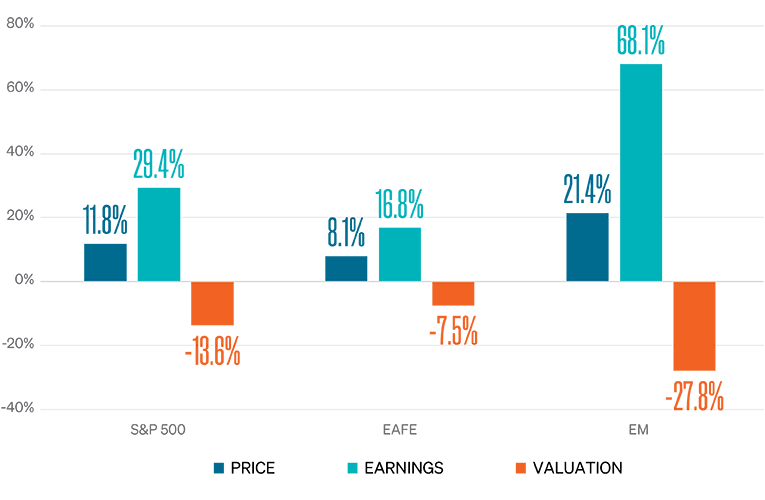
» The chart splits each market’s 2026 price return into earnings growth and the change in valuation. All three rose, from 8.1% for EAFE to 21.4% for emerging markets, entirely on earnings.
» Higher rates explain most of the valuation reset, since a 10-year paying more than 5% gives stocks real competition, and the S&P 500’s forward P/E has slid from 22 to 19, in line with its 10-year average.
» Emerging markets show the gap at its widest, as booming AI memory demand pushed forward earnings up 68.1%, led by Samsung and SK Hynix, and left the index more than a quarter cheaper than in January despite leading every major market this year.
» This market is skeptical of the AI boom, not scared of it, a healthier setup than one running on rising multiples. All 11 sectors are expected to grow Q3 profits, so if rates settle, valuations have room to recover.
A MIDTERM YEAR WITHOUT THE MIDTERM SLUMP
SOURCE: MEEDER ADVISORY SERVICES, Y CHARTS, DATA AS OF SEPTEMBER 30, 2026. THE PERFORMANCE DATA SHOWN REPRESENTS PAST PERFORMANCE, WHICH DOES NOT GUARANTEE FUTURE RESULTS..
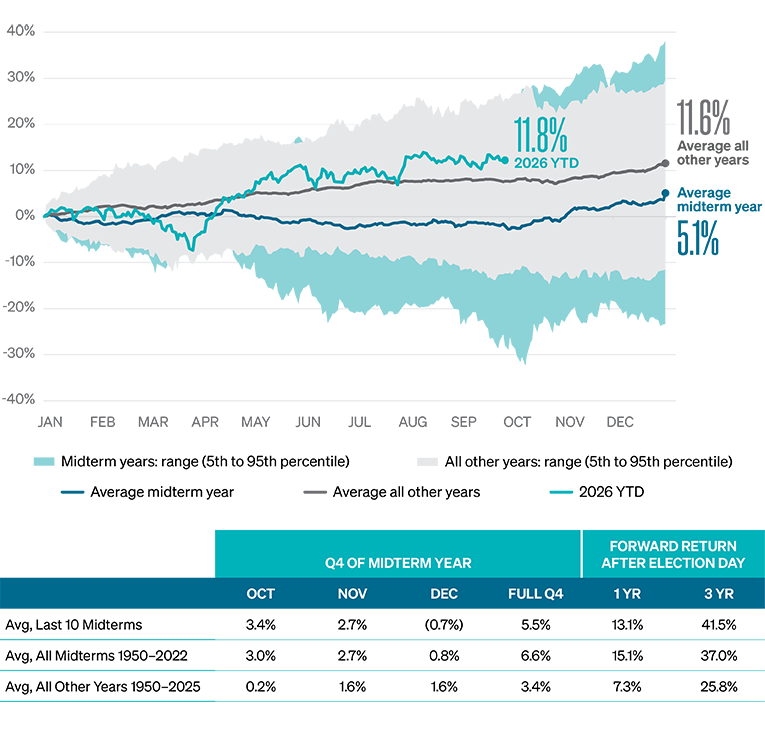
» The chart overlays the S&P 500’s path in midterm years against all other years since 1950. Midterm years swing wider, with the weakest down more than 30% by early October, and the average one has finished up just 5.1% versus 11.6% for all others.
» Most of that gap opens before the vote. Fourth quarters of midterm years have averaged 6.6% since 1950, nearly double the 3.4% for other years, and the 12 months after Election Day 15.1% versus 7.3%.
» 2026 has run well ahead of that script, shrugging off a spring pullback on the oil shock to sit up 11.8% on a price basis heading into Q4, already level with the full-year average for non-midterm years.
» Part of the usual post-election rally is a rebound from midterm lows that 2026 never hit, so we would not lean on the calendar too hard this time. The chart’s firmer lesson still holds, that elections have rarely been a good reason to step out of the market.
INDEX DESCRIPTIONS
Investors cannot invest directly in an index. The performance of any index is not indicative of the performance of any investment and does not take into account the effects of inflation and the fees and expenses associated with investing.
S&P 500 Index: The Index tracks the stock performance of 500 of the largest companies listed on stock exchanges in the United States. It is one of the most followed equity indices and includes approximately 80% of the total market capitalization of U.S. public companies. Russell 1000 Growth Index: The Index measures the performance of the large-cap growth segment of the US equity universe. It includes those Russell 1000 companies with relatively higher price-to-book ratios, higher I/B/E/S forecast medium-term (2-year) growth, and higher sales per share historical growth. The Index is constructed to provide a comprehensive and unbiased barometer for the large-cap growth segment. The index is completely reconstituted annually to ensure new and growing equities are included and that the represented companies continue to reflect growth characteristics. Russell 1000 Value Index: The Index measures the performance of the large-cap value segment of the US equity universe. It includes those Russell 1000 companies with relatively lower price-to-book ratios, lower I/B/E/S forecast medium-term (2 years) growth, and lower sales per share historical growth (5 years). The Index is constructed to provide a comprehensive and unbiased barometer for the large-cap value segment. The index is completely reconstituted annually to ensure new and growing equities are included and that the represented companies continue to reflect value characteristics. Russell 2000 Index: The Index is constructed to provide a comprehensive, unbiased barometer of the small-cap segment of the US equity market. A subset of the Russell 3000 Index, it includes approximately 2,000 of the smallest securities based on a combination of their market cap and current index membership. MSCI EAFE Index: The Index is an equity index that captures large and mid-cap representation across 21 Developed Markets countries* around the world, excluding the US and Canada. With 783 constituents, the index covers approximately 85% of the free float-adjusted market capitalization in each country. MSCI EM Index: The Index captures large and mid-cap representation across 24 Emerging Markets (EM) countries*. With 1,440 constituents, the index covers approximately 85% of the free float-adjusted market capitalization in each country. Bloomberg US Aggregate Bond Index: The Index is a broad-based flagship benchmark that measures the investment grade, US dollar-denominated, fixed-rate taxable bond market. The index includes Treasuries, government-related and corporate securities, fixed-rate agency MBS, ABS, and CMBS (agency and non-agency). Provided the necessary inclusion rules are met, US Aggregate-eligible securities also contribute to the multi-currency Global Aggregate Index and the US Universal Index. The US Aggregate Index was created in 1986, with history backfilled to January 1, 1976. Bloomberg US Corporate High Yield Bond Index: The Index measures the USD-denominated, high yield, fixed-rate corporate bond market. Securities are classified as high yield if the middle rating of Moody’s, Fitch and S&P is Ba1/BB+/BB+ or below. Bonds from issuers with an emerging markets country of risk, based on the indices’ EM country definition, are excluded. The US Corporate High Yield Index is a component of the US Universal and Global High Yield Indices. The index was created in 1998, with history backfilled to July 1, 1983.
IMPORTANT DISCLOSURES
The views expressed herein are exclusively those of Meeder Investment Management, Inc., are not offered as investment advice, and should not be construed as a recommendation regarding the suitability of any investment product or strategy for an individual’s particular needs. Investment in securities entails risk, including loss of principal. Asset allocation and diversification do not assure a profit or protect against loss. There can be no assurance that any investment strategy will achieve its objectives, generate positive returns, or avoid losses. The performance data shown represents past performance, which does not guarantee future results.
Commentary offered for informational and educational purposes only. Opinions and forecasts regarding markets, securities, products, portfolios, or holdings are given as of the date provided and are subject to change at any time. No offer to sell, solicit, or recommend any security or investment product is intended. Certain information and data has been supplied by unaffiliated third parties as indicated. Although Meeder believes the information is reliable, it cannot warrant the accuracy, timeliness or suitability of the information or materials offered by third parties.
Investment advisory services provided by Meeder Advisory Services, Inc.
©2026 Meeder Investment Management, Inc.
0373-MAS-10/12/26-54665
