You are now leaving Meeder Investment Management. Links to other websites are provided for your convenience and information only. When you click on a link to another website you will be leaving this website. The fact that Meeder Investment Management provides links to other websites does not mean that we endorse, authorize or sponsor the linked website, or that we are affiliated with that website’s owners or sponsors. This material is being provided for informational purposes only and is not a solicitation or an offer to buy any security or to participate in any planning or investment strategy. Unless otherwise indicated, the linked sites are not under our control and we are not responsible for and assume no liability for the content or presentation of any linked site or any link contained in a linked site, or any changes or updates to such sites. We make no representations about the accuracy or completeness of the information contained in any linked sites and their privacy and security policies may differ from ours. We recommend that you review this third-party’s policies and terms carefully.
July 2025: Capital Markets Commentary

A Summer Surge in Equities
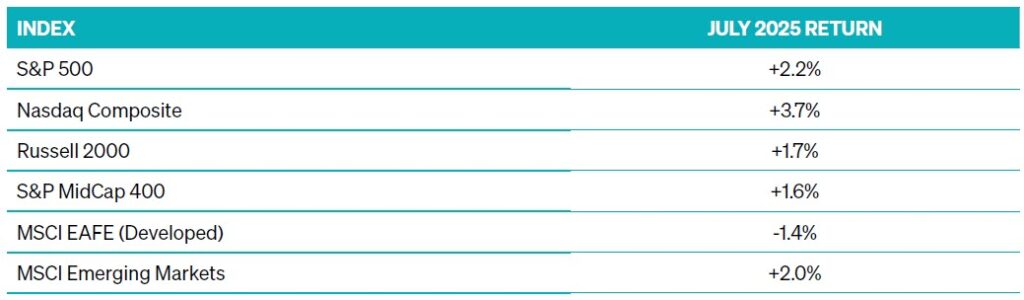
U.S. equity markets posted strong gains in July, led once again by mega-cap growth stocks. The S&P 500 gained 2.2% for the month, bringing its year-to-date return to 8.6%. The Nasdaq Composite, powered by optimism in AI-driven innovation and a wave of earnings beats among top tech names, climbed 3.7%. Small- and mid-cap equities also participated in the rally but continue to lag large-cap peers for the year. The Russell 2000 gained 1.7% in July but remains in modest negative territory year-to-date (YTD).
Markets were buoyed by strong corporate earnings reports, with roughly 81% of S&P 500 companies beating analyst estimates thus far. Notably, sectors tied to consumer demand and AI infrastructure—like technology, communication services, and industrials—are showing resilience amid geopolitical noise and softening inflation data.
Tariffs on the European Union of 50% were initially slated to take effect on June 1, 2025. President Trump delayed this implementation until July 9 as an effort for the two sides to negotiate a deal.
The Fed Walks the Line
The Federal Reserve held rates steady at its July meeting, maintaining its target range at 4.25%–4.50%. Chair Jerome Powell reiterated a “data-dependent” approach, noting recent economic strength and inflation deceleration as encouraging but not yet conclusive. Futures markets suggest increased confidence that rate cuts could begin by September, with expectations for two cuts priced in by December.
The July jobs report showed significant labor market weakness. Nonfarm payrolls totaled 73,000 for July, while June and May totals were revised sharply lower, down by a combined 258,000 from previously announced levels. This weak report significantly increased the odds of a rate cut in September, as the unemployment rate jumped slightly to 4.2%.
International Equities Lead
Developed international markets have been a bright spot for diversified investors in 2025 but underperformed in July. The MSCI EAFE Index declined -1.4% in July, while its YTD gains are over 18%—driven by a weaker U.S. dollar and strong corporate earnings in Europe and Japan. Emerging markets also saw positive momentum as commodity prices stabilized, and China implemented modest stimulus measures to support its property sector and domestic demand.
Earnings Season Signals Stability
About 90% of the way through second quarter earnings season, the S&P 500 is reporting pretty strong results. Blended Q2 earnings growth for the S&P 500 is on track to reach 11.8% year-over-year, marking the third consecutive quarter of double-digit earnings growth for the index, per FactSet. Margins have remained resilient as firms focus on efficiency, automation, and pricing discipline.
Looking Ahead
After a volatile first half of 2025 dominated by tariff headlines, slowing GDP, and policy uncertainty, July offered a welcome shift toward market stability. While risks remain—from geopolitical flashpoints to potential credit downgrades—investors are finding renewed confidence in earnings and inflation moderation, while recent labor market data is providing some concern about the soft landing. As always, we continue to advocate for a balanced, disciplined approach and remain watchful for signs of shifting momentum across sectors and asset classes.
Commentary offered for informational and educational purposes only. Opinions and forecasts regarding markets, securities, products, portfolios, or holdings are given as of the date provided and are subject to change at any time. No offer to sell, solicit, or recommend any security or investment product is intended. Certain information and data has been supplied by unaffiliated third parties as indicated. Although Meeder believes the information is reliable, it cannot warrant the accuracy, timeliness or suitability of the information or materials offered by third parties.
Investors cannot invest directly in an index. The performance of any index is not indicative of the performance of any investment and does not take into account the effects of inflation and the fees and expenses associated with investing.
INDEX DESCRIPTIONS
S&P 500 Index: The Index tracks the stock performance of 500 of the largest companies listed on stock exchanges in the United States. It is one of the most followed equity indices and includes approximately 80% of the total market capitalization of U.S. public companies.
Nasdaq Composite Index: The Nasdaq Composite Index includes over 3,000 common equities listed on the Nasdaq stock exchange. It is heavily weighted toward technology and growth-oriented companies.
Russell 2000 Index: The Russell 2000 Index measures the performance of approximately 2,000 small-cap U.S. companies. It is a subset of the Russell 3000 Index and serves as a benchmark for small-cap investing.
S&P MidCap 400 Index: This index represents the mid-size segment of the U.S. equity market. It includes 400 companies selected based on size, liquidity, and industry representation and provides investors with a benchmark for mid-cap exposure.
MSCI EAFE Index: The MSCI EAFE (Europe, Australasia, and Far East) Index captures large- and mid-cap performance across 21 developed markets, excluding the U.S. and Canada. It is commonly used to benchmark international developed equity performance.
MSCI Emerging Markets (EM) Index: The MSCI EM Index captures large- and mid-cap equity performance across 24 emerging markets countries. It represents approximately 85% of the free float-adjusted market capitalization in each country.
Investment advisory services offered by Meeder Advisory Services, Inc
©2025 Meeder Investment Management, Inc.
0289-MAS-8/12/25-52121