You are now leaving Meeder Investment Management. Links to other websites are provided for your convenience and information only. When you click on a link to another website you will be leaving this website. The fact that Meeder Investment Management provides links to other websites does not mean that we endorse, authorize or sponsor the linked website, or that we are affiliated with that website’s owners or sponsors. This material is being provided for informational purposes only and is not a solicitation or an offer to buy any security or to participate in any planning or investment strategy. Unless otherwise indicated, the linked sites are not under our control and we are not responsible for and assume no liability for the content or presentation of any linked site or any link contained in a linked site, or any changes or updates to such sites. We make no representations about the accuracy or completeness of the information contained in any linked sites and their privacy and security policies may differ from ours. We recommend that you review this third-party’s policies and terms carefully.

We can manage around those concentrated positions and tailor the portfolio for the inclusion or exclusionof specific sectors or securities. Clients have direct ownership of the individual stocks inside their portfolio. Therefore, the cost basis of those stock positions is the client’s. This structure is unlike a mutual fund or an ETF where they own the fund or ETF’s cost basis, not the actual individual stock position basis. Private wealth allows for transferring positions in kind so clients don’t have to abruptly sell existing securities. Instead, portfolio managers can transfer those positions by reducing over time as opportunities arise, in a tax efficientmanner. Investors understand the consequences of taxes on their portfolio and want their advisor to have a proactive approach to minimize that tax obligation while still maintaining a high level of personalization and expertise.
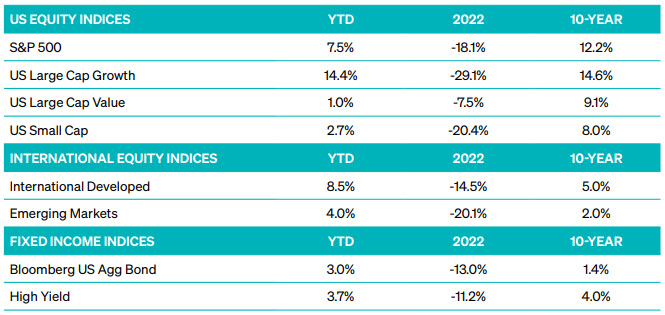
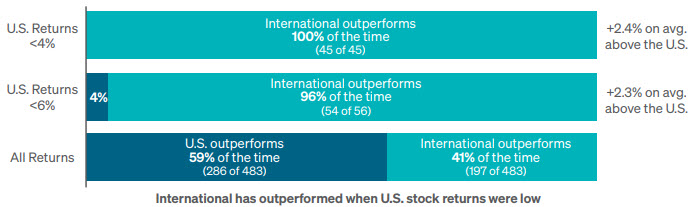
Looking ahead, diversification will likely be far more valuable than in the previous 10 years, which was a period of a rising U.S. dollar, low interest rates, and low inflation. While it’s important to note that we shouldn’t rely solely on the year-to-date returns to predict future performance, we are keeping an eye out for future opportunities and specifically we are looking at international and small-cap equities.
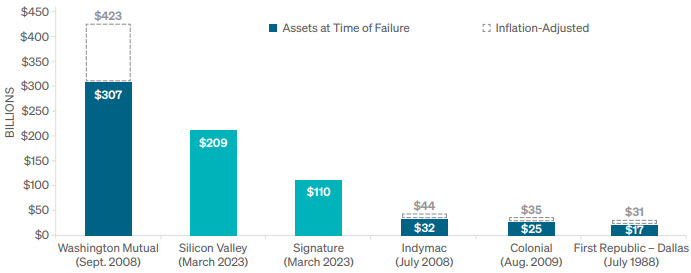
The first quarter saw several large bank failures. However, it’s important to note that this is not 2008. Unlike the global financial crisis, which was driven by price declines in low-quality assets, the recent bank issues stemmed from concentrated deposits and poor interest rate risk management, not bad loans. The current crisis may result in a tightening of financial conditions, with Goldman Sachs estimating that it is equivalent to a 50 basis point interest rate hike. It’s worth noting that banks are well-capitalized, and the Fed and Treasury are committed to protecting the solvency of the banking sector, thereby reducing the risk of a global event.
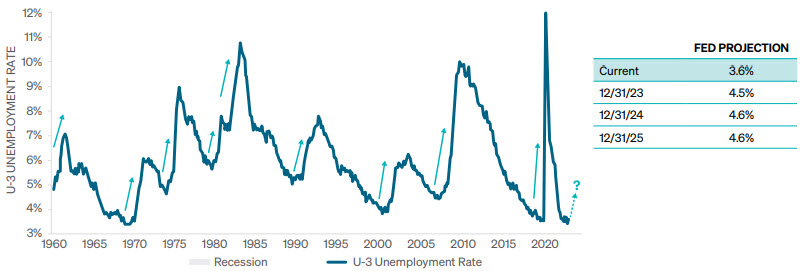
The Fed closely monitors unemployment and inflation to assess whether they need to change course. While inflation peaked at 9.1% in June of 2022 and has since declined for nine months, employment remains tight. The chart below shows the unemployment rate dating back to 1960, with recessions shaded in grey. As of the latest data, the current unemployment rate stands at 3.5%, which is close to a 50-year low.
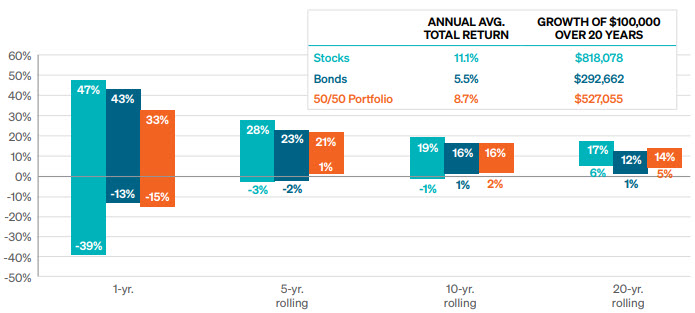
Volatility in equity markets can be expected, with an average annual drop of 10%. Clients should maintain a longer-term perspective and recognize that interest rates may decrease looking forward. It is crucial to stick to your plan and maintain a longer time horizon. The graph below illustrates the returns of stocks, bonds, and a balanced 50/50 portfolio over a one-year period, with green representing the S&P 500 Index and blue representing the Bloomberg U.S. Aggregate Bond Index. The grey bars represent a balanced portfolio. Returns vary significantly over one year, but over five, ten, and twenty years, the range of outcomes is substantially reduced. For instance, a balanced portfolio over five years has never had a negative return over the analysis period. Clients must have a long-term investment horizon and ensure they are in the appropriate risk profile. While there may be increased volatility over one year, this can also create investment opportunities.
Commentary offered for informational and educational purposes only. Opinions and forecasts regarding markets, securities, products, portfolios, or holdings are given as of the date provided and are subject to change at any time. No offer to sell, solicitation, or recommendation of any security or investment product is intended. Certain information and data has been supplied by unaffiliated third parties as indicated. Although Meeder believes the information is reliable, it cannot warrant the accuracy, timeliness or suitability of the information or materials offered by third parties.
Investment advisory services provided by Meeder Asset Management, Inc.
©2023 Meeder Investment Management, Inc.
0183-MAS-5/5/2023-33571